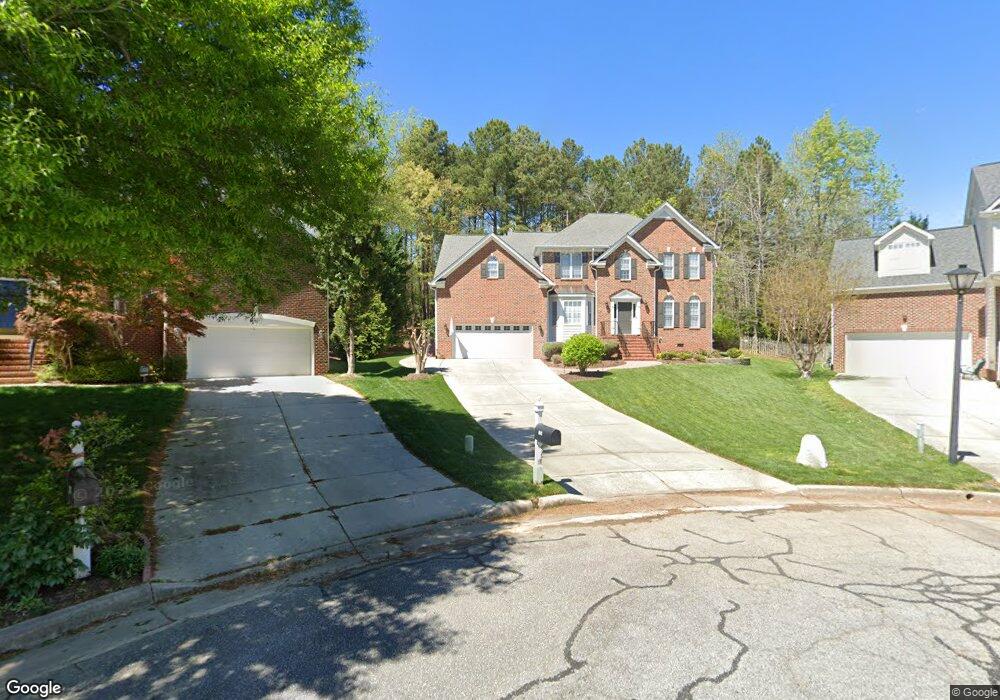
109 Manora Ln Chapel Hill, NC 27516
Estimated Value: $753,000 - $822,000
4
Beds
3
Baths
3,214
Sq Ft
$249/Sq Ft
Est. Value
About This Home
This home is located at 109 Manora Ln, Chapel Hill, NC 27516 and is currently estimated at $798,875, approximately $248 per square foot. 109 Manora Ln is a home located in Orange County with nearby schools including Northside Elementary School, Smith Middle School, and Chapel Hill High School.
Ownership History
Date
Name
Owned For
Owner Type
Purchase Details
Closed on
Oct 29, 2015
Sold by
Natishan John M and Natishan Jacqueline G
Bought by
Trygstad Troy and Trygstad Peggy
Current Estimated Value
Home Financials for this Owner
Home Financials are based on the most recent Mortgage that was taken out on this home.
Original Mortgage
$417,000
Outstanding Balance
$329,542
Interest Rate
3.93%
Mortgage Type
New Conventional
Estimated Equity
$469,333
Purchase Details
Closed on
Jun 19, 2009
Sold by
Maulucci Richard and Turner Tracey Elizabeth
Bought by
Natishan John M and Natishan Jacqueline G
Home Financials for this Owner
Home Financials are based on the most recent Mortgage that was taken out on this home.
Original Mortgage
$155,000
Interest Rate
4.88%
Mortgage Type
Purchase Money Mortgage
Purchase Details
Closed on
Jun 11, 2001
Sold by
Northwood V Inc
Bought by
Centex Homes
Create a Home Valuation Report for This Property
The Home Valuation Report is an in-depth analysis detailing your home's value as well as a comparison with similar homes in the area
Home Values in the Area
Average Home Value in this Area
Purchase History
| Date | Buyer | Sale Price | Title Company |
|---|---|---|---|
| Trygstad Troy | $485,000 | None Available | |
| Natishan John M | $490,000 | None Available | |
| Centex Homes | $1,650,000 | -- |
Source: Public Records
Mortgage History
| Date | Status | Borrower | Loan Amount |
|---|---|---|---|
| Open | Trygstad Troy | $417,000 | |
| Previous Owner | Natishan John M | $155,000 |
Source: Public Records
Tax History Compared to Growth
Tax History
| Year | Tax Paid | Tax Assessment Tax Assessment Total Assessment is a certain percentage of the fair market value that is determined by local assessors to be the total taxable value of land and additions on the property. | Land | Improvement |
|---|---|---|---|---|
| 2025 | $10,400 | $785,300 | $300,000 | $485,300 |
| 2024 | $8,480 | $496,200 | $130,000 | $366,200 |
| 2023 | $8,247 | $496,200 | $130,000 | $366,200 |
| 2022 | $7,905 | $496,200 | $130,000 | $366,200 |
| 2021 | $7,803 | $496,200 | $130,000 | $366,200 |
| 2020 | $7,816 | $466,900 | $150,000 | $316,900 |
| 2018 | $7,757 | $474,400 | $150,000 | $324,400 |
| 2017 | $7,458 | $474,400 | $150,000 | $324,400 |
| 2016 | $7,458 | $449,994 | $86,821 | $363,173 |
| 2015 | $7,458 | $449,994 | $86,821 | $363,173 |
| 2014 | $7,413 | $449,994 | $86,821 | $363,173 |
Source: Public Records
Map
Nearby Homes
- 121 Old Larkspur Way
- 200 Worsham Dr
- 427 New Parkside Dr
- 310 New Parkside Dr
- 300 Christine Ct
- 306 New Parkside Dr
- 100 Pebble Ct
- 6117 Highway 86
- 132 Malbec Dr
- 124 Malbec Way
- 114 Malbec Dr
- 117 Gamay Dr
- 124 Malbec Dr
- 115 Gamay Dr
- 101 Gamay Dr
- 115 Gamey Dr
- 104 Malbec Way
- 104 Malbec Dr
- 128 Rialto St
- 103 Golden Gate Ln