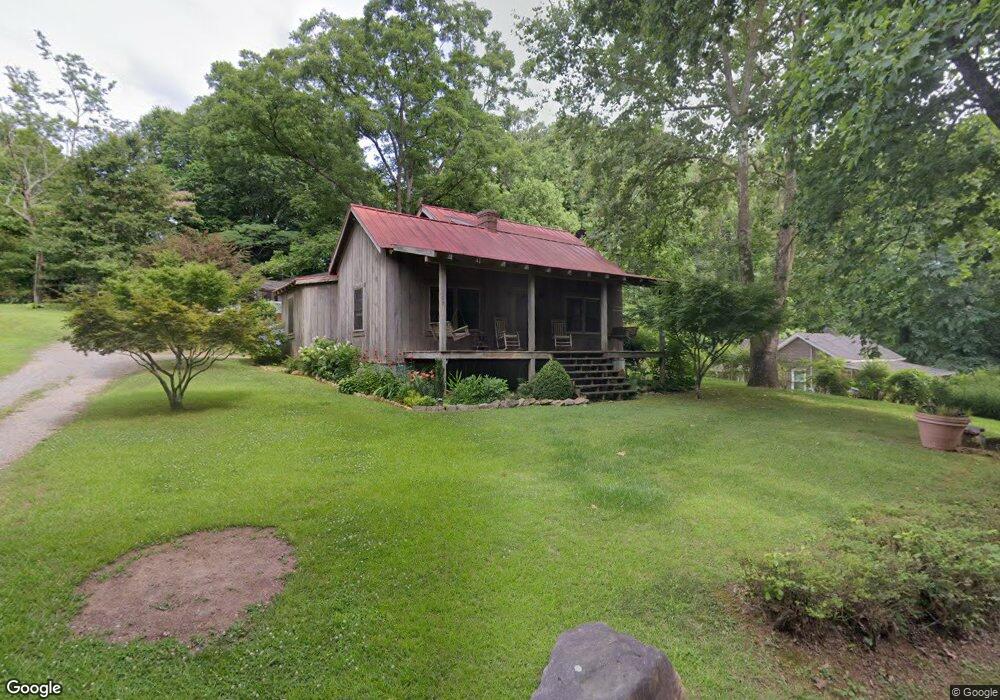
109 Maple Ln Canton, GA 30115
Estimated Value: $222,000 - $278,000
1
Bed
1
Bath
672
Sq Ft
$363/Sq Ft
Est. Value
About This Home
This home is located at 109 Maple Ln, Canton, GA 30115 and is currently estimated at $244,036, approximately $363 per square foot. 109 Maple Ln is a home located in Cherokee County with nearby schools including Holly Springs Elementary School, Rusk Middle School, and Sequoyah High School.
Ownership History
Date
Name
Owned For
Owner Type
Purchase Details
Closed on
Nov 4, 2024
Sold by
Buchanan Tracy
Bought by
Higgins Jody and Higgins Scarlett
Current Estimated Value
Purchase Details
Closed on
Jul 10, 2019
Sold by
Herlache Kathaleen Malinda
Bought by
Buchanan Tracy and Buchanan Ricky
Purchase Details
Closed on
Jun 1, 2018
Sold by
Starchevskiy Aleksander
Bought by
Herlache Kathaleen Malinda
Purchase Details
Closed on
May 3, 2013
Sold by
Secretary Of Housing And U
Bought by
Starchevskiy Aleksander
Purchase Details
Closed on
Dec 4, 2012
Sold by
Metlife Home Loans
Bought by
Secretary Of Housing And Urban
Create a Home Valuation Report for This Property
The Home Valuation Report is an in-depth analysis detailing your home's value as well as a comparison with similar homes in the area
Home Values in the Area
Average Home Value in this Area
Purchase History
| Date | Buyer | Sale Price | Title Company |
|---|---|---|---|
| Higgins Jody | $230,000 | -- | |
| Buchanan Tracy | $150,000 | -- | |
| Herlache Kathaleen Malinda | $75,000 | -- | |
| Starchevskiy Aleksander | $36,000 | -- | |
| Secretary Of Housing And Urban | $121,601 | -- | |
| Metlife Home Loans | $121,601 | -- |
Source: Public Records
Tax History
| Year | Tax Paid | Tax Assessment Tax Assessment Total Assessment is a certain percentage of the fair market value that is determined by local assessors to be the total taxable value of land and additions on the property. | Land | Improvement |
|---|---|---|---|---|
| 2025 | $4,624 | $91,612 | $19,800 | $71,812 |
| 2024 | $2,767 | $92,760 | $17,200 | $75,560 |
| 2023 | $3,125 | $98,620 | $16,200 | $82,420 |
| 2022 | $1,957 | $63,356 | $16,200 | $47,156 |
| 2021 | $1,439 | $57,336 | $16,200 | $41,136 |
| 2020 | $1,807 | $53,596 | $15,000 | $38,596 |
| 2019 | $755 | $30,040 | $9,600 | $20,440 |
| 2018 | $608 | $24,000 | $8,000 | $16,000 |
| 2017 | $542 | $53,000 | $6,400 | $14,800 |
| 2016 | $542 | $52,600 | $6,400 | $14,640 |
| 2015 | $494 | $47,600 | $5,440 | $13,600 |
| 2014 | $503 | $48,300 | $5,440 | $13,880 |
Source: Public Records
Map
Nearby Homes
- 482 Palm St
- 542 Palm St
- 554 Palm St
- 3072 Holly Springs Pkwy
- 3060 Holly Springs Pkwy
- 3132 Holly Springs Pkwy
- 164 Palm St
- 134 Childers Rd
- 1021 Palm St
- 161 W Mountain Oak St
- 195 Redbud Rd
- 191 Redbud Rd
- 187 Redbud Rd
- 183 Redbud Rd
- 179 Redbud Rd
- 175 Redbud Rd
- 330 Sassafras Way
- 1414 Palm St
- 454 Sugarberry Ln