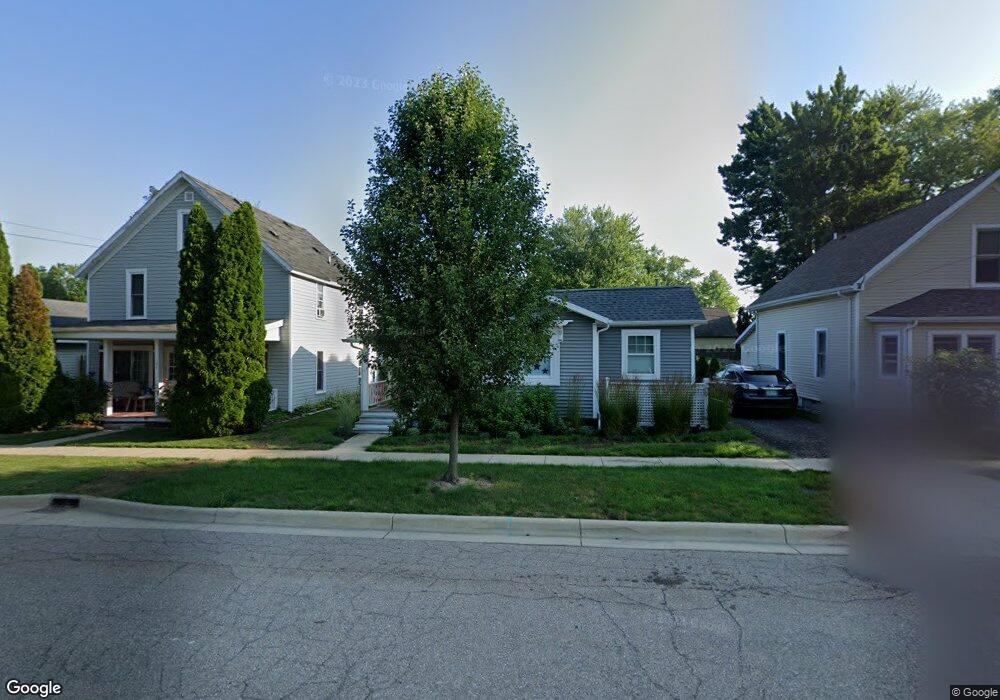
109 Maple St Three Oaks, MI 49128
Estimated Value: $193,845 - $255,000
2
Beds
1
Bath
960
Sq Ft
$240/Sq Ft
Est. Value
About This Home
This home is located at 109 Maple St, Three Oaks, MI 49128 and is currently estimated at $230,211, approximately $239 per square foot. 109 Maple St is a home located in Berrien County with nearby schools including River Valley Middle/High School.
Ownership History
Date
Name
Owned For
Owner Type
Purchase Details
Closed on
Aug 7, 2023
Sold by
Dahms Pamela M
Bought by
Sechler Kent J
Current Estimated Value
Purchase Details
Closed on
May 28, 2019
Sold by
Nationstar Mortgage Llc
Bought by
Dahms Pamela M
Purchase Details
Closed on
Sep 27, 2018
Sold by
Snow Kelley
Bought by
Nationstar Mortgage Llc and Cooper
Purchase Details
Closed on
Jul 20, 2005
Sold by
Horton David L and Davison Jessie M
Bought by
Snow Kelly
Home Financials for this Owner
Home Financials are based on the most recent Mortgage that was taken out on this home.
Original Mortgage
$106,036
Interest Rate
5.71%
Mortgage Type
FHA
Purchase Details
Closed on
Feb 3, 1997
Purchase Details
Closed on
Nov 11, 1994
Purchase Details
Closed on
May 26, 1989
Create a Home Valuation Report for This Property
The Home Valuation Report is an in-depth analysis detailing your home's value as well as a comparison with similar homes in the area
Purchase History
| Date | Buyer | Sale Price | Title Company |
|---|---|---|---|
| Sechler Kent J | -- | None Listed On Document | |
| Dahms Pamela M | $56,000 | Servicelink Llc | |
| Nationstar Mortgage Llc | $67,500 | None Available | |
| Snow Kelly | -- | -- | |
| -- | $33,900 | -- | |
| -- | $16,500 | -- | |
| -- | -- | -- |
Source: Public Records
Mortgage History
| Date | Status | Borrower | Loan Amount |
|---|---|---|---|
| Previous Owner | Snow Kelly | $106,036 | |
| Closed | Nationstar Mortgage Llc | $0 |
Source: Public Records
Tax History
| Year | Tax Paid | Tax Assessment Tax Assessment Total Assessment is a certain percentage of the fair market value that is determined by local assessors to be the total taxable value of land and additions on the property. | Land | Improvement |
|---|---|---|---|---|
| 2025 | $706 | $56,700 | $0 | $0 |
| 2024 | $879 | $51,400 | $0 | $0 |
| 2023 | $1,021 | $50,800 | $0 | $0 |
| 2021 | $1,119 | $38,500 | $11,300 | $27,200 |
| 2020 | $1,053 | $27,300 | $0 | $0 |
| 2019 | $1,974 | $39,800 | $8,300 | $31,500 |
Source: Public Records
Map
Nearby Homes
- 103 Maple St
- 202 Maple St
- 201 Sycamore St E
- 207 Cherry St
- 9 Beech St E
- 8 Poplar St
- 308 N Elm St
- 37 Huckleberry
- 202 S Elm St
- 409 Oak St
- 5463 U S 12
- 7079 U S 12
- 7200 U S 12
- 607 Sherwood Ave
- 614 Magnolia St
- 616 Magnolia St
- 710 S Elm St
- 7078 Us 12 Hwy W
- 18216 S Schwark Rd
- 0 W Elm Valley Rd Unit 25049923
Your Personal Tour Guide
Ask me questions while you tour the home.