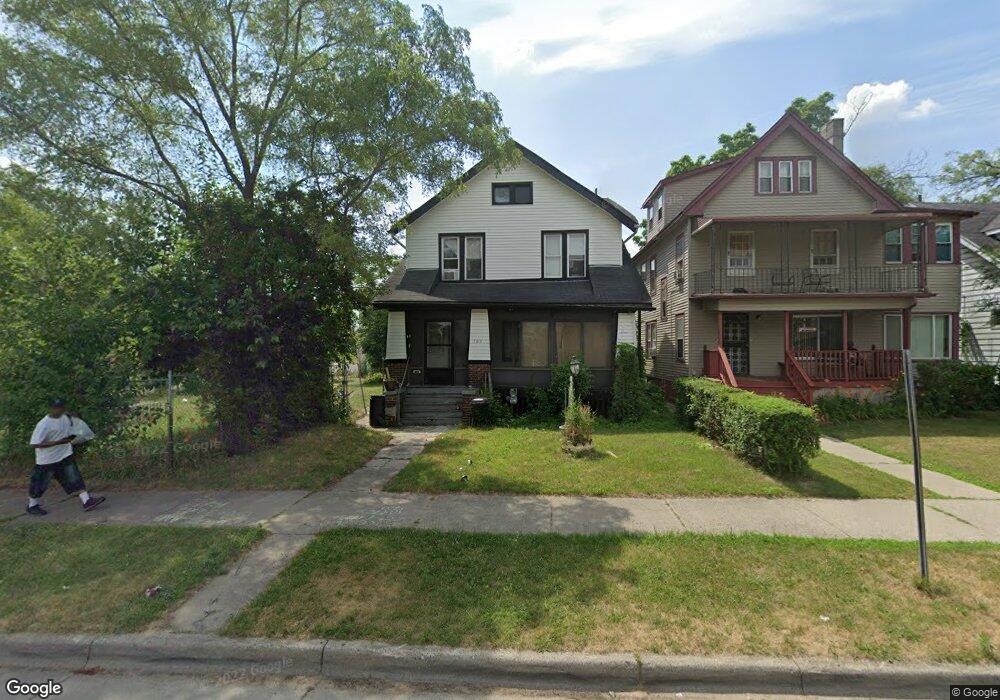
109 Midland St Highland Park, MI 48203
Estimated Value: $77,000 - $165,000
4
Beds
2
Baths
1,620
Sq Ft
$75/Sq Ft
Est. Value
About This Home
This home is located at 109 Midland St, Highland Park, MI 48203 and is currently estimated at $122,283, approximately $75 per square foot. 109 Midland St is a home located in Wayne County with nearby schools including George Washington Carver Elementary School, New Paradigm Glazer Academy, and Barber Elementary School.
Ownership History
Date
Name
Owned For
Owner Type
Purchase Details
Closed on
Nov 10, 2015
Sold by
Treasurer Of The Charter County Of Wayne
Bought by
Capital Venture Group Llc
Current Estimated Value
Purchase Details
Closed on
Oct 23, 2012
Sold by
Harbour Portfolio Vii Lp
Bought by
Wakefield Antonio
Purchase Details
Closed on
Mar 21, 2012
Sold by
Federal National Mortgage Association
Bought by
Harbour Portfolio Vii Lp
Purchase Details
Closed on
Oct 20, 2010
Sold by
Driver Zada M
Bought by
Federal National Mortgage Association
Purchase Details
Closed on
Apr 23, 2004
Sold by
Martin Zada M and Driver Zada M
Bought by
Driver Zada M
Home Financials for this Owner
Home Financials are based on the most recent Mortgage that was taken out on this home.
Original Mortgage
$50,000
Interest Rate
8.5%
Mortgage Type
New Conventional
Create a Home Valuation Report for This Property
The Home Valuation Report is an in-depth analysis detailing your home's value as well as a comparison with similar homes in the area
Home Values in the Area
Average Home Value in this Area
Purchase History
| Date | Buyer | Sale Price | Title Company |
|---|---|---|---|
| Capital Venture Group Llc | $7,300 | None Available | |
| Wakefield Antonio | $7,000 | None Available | |
| Harbour Portfolio Vii Lp | $2,205 | None Available | |
| Federal National Mortgage Association | $66,766 | None Available | |
| Driver Zada M | -- | -- |
Source: Public Records
Mortgage History
| Date | Status | Borrower | Loan Amount |
|---|---|---|---|
| Previous Owner | Driver Zada M | $50,000 |
Source: Public Records
Tax History Compared to Growth
Tax History
| Year | Tax Paid | Tax Assessment Tax Assessment Total Assessment is a certain percentage of the fair market value that is determined by local assessors to be the total taxable value of land and additions on the property. | Land | Improvement |
|---|---|---|---|---|
| 2025 | $876 | $41,700 | $0 | $0 |
| 2024 | $876 | $37,500 | $0 | $0 |
| 2023 | $840 | $33,500 | $0 | $0 |
| 2022 | $959 | $26,000 | $0 | $0 |
| 2021 | $940 | $17,700 | $0 | $0 |
| 2019 | $984 | $12,500 | $0 | $0 |
| 2018 | $833 | $9,900 | $0 | $0 |
| 2017 | $310 | $9,900 | $0 | $0 |
| 2016 | $1,264 | $11,600 | $0 | $0 |
| 2015 | $1,430 | $14,300 | $0 | $0 |
| 2013 | $2,040 | $20,400 | $0 | $0 |
| 2012 | $666 | $22,100 | $3,500 | $18,600 |
Source: Public Records
Map
Nearby Homes