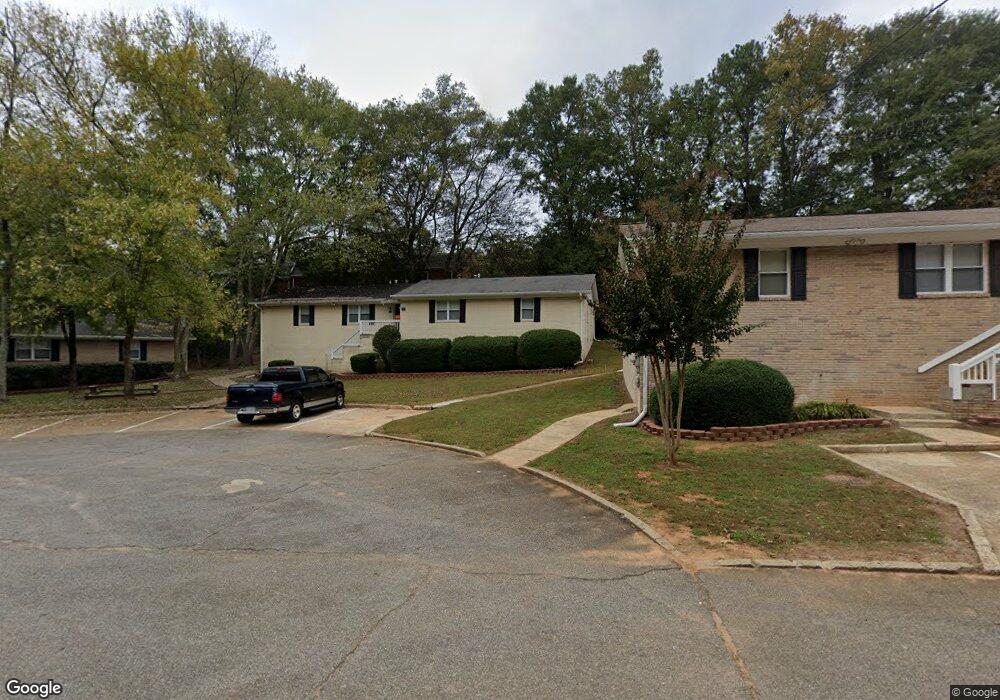
109 Millbrook Cir Roswell, GA 30075
Estimated Value: $335,000 - $633,000
6
Beds
2
Baths
1,998
Sq Ft
$252/Sq Ft
Est. Value
About This Home
This home is located at 109 Millbrook Cir, Roswell, GA 30075 and is currently estimated at $502,775, approximately $251 per square foot. 109 Millbrook Cir is a home located in Fulton County with nearby schools including Vickery Mill Elementary, Crabapple Middle School, and Roswell High School.
Ownership History
Date
Name
Owned For
Owner Type
Purchase Details
Closed on
Feb 25, 2005
Sold by
Barrientos Carlos and Barrientos Neida
Bought by
Housing Inititive Of North Fulto
Current Estimated Value
Home Financials for this Owner
Home Financials are based on the most recent Mortgage that was taken out on this home.
Original Mortgage
$180,000
Interest Rate
5.6%
Mortgage Type
New Conventional
Purchase Details
Closed on
Oct 24, 2001
Sold by
Barrientos Carlos H
Bought by
Barrientos Carlos H and Barrientos Neida J
Home Financials for this Owner
Home Financials are based on the most recent Mortgage that was taken out on this home.
Original Mortgage
$68,800
Interest Rate
6.15%
Mortgage Type
New Conventional
Purchase Details
Closed on
Oct 23, 1996
Sold by
Collins Lee
Bought by
Barrientos Carlos H
Create a Home Valuation Report for This Property
The Home Valuation Report is an in-depth analysis detailing your home's value as well as a comparison with similar homes in the area
Home Values in the Area
Average Home Value in this Area
Purchase History
| Date | Buyer | Sale Price | Title Company |
|---|---|---|---|
| Housing Inititive Of North Fulto | $180,000 | -- | |
| Barrientos Carlos H | -- | -- | |
| Barrientos Carlos H | $984,900 | -- |
Source: Public Records
Mortgage History
| Date | Status | Borrower | Loan Amount |
|---|---|---|---|
| Closed | Housing Inititive Of North Fulto | $180,000 | |
| Previous Owner | Barrientos Carlos H | $68,800 | |
| Closed | Barrientos Carlos H | $0 |
Source: Public Records
Tax History Compared to Growth
Tax History
| Year | Tax Paid | Tax Assessment Tax Assessment Total Assessment is a certain percentage of the fair market value that is determined by local assessors to be the total taxable value of land and additions on the property. | Land | Improvement |
|---|---|---|---|---|
| 2025 | $4,031 | $141,280 | $53,200 | $88,080 |
| 2023 | $4,031 | $142,800 | $50,960 | $91,840 |
| 2022 | $3,581 | $126,880 | $35,520 | $91,360 |
| 2021 | $3,063 | $119,880 | $33,720 | $86,160 |
| 2020 | $3,063 | $108,520 | $31,080 | $77,440 |
| 2019 | $3,256 | $115,360 | $28,960 | $86,400 |
| 2018 | $2,628 | $93,120 | $33,960 | $59,160 |
| 2017 | $1,916 | $65,680 | $20,960 | $44,720 |
| 2016 | -- | $65,680 | $20,960 | $44,720 |
| 2015 | -- | $65,680 | $20,960 | $44,720 |
| 2014 | -- | $65,680 | $20,960 | $44,720 |
Source: Public Records
Map
Nearby Homes
- 7307 Saint Charles Square
- 250 Blessing Way
- 1920 Liberty Ln
- 707 Roswell Landings Dr
- 117 Bridgecrest Rd Unit 24
- Brayton Plan at The Groves at Myrtle
- 119 Bridgecrest Rd
- 121 Bridgecrest Rd
- Blake Plan at The Groves at Myrtle
- 117 Bridgecrest Rd
- 121 Bridgecrest Rd Unit 26
- 104 Bridgecrest Rd
- 920 Freedom Ln Unit 1501
- 2110 Constitution Ct
- 1315 Freedom Ln
- 370 Stonebridge Trail Unit 3
- 350 Stonebridge Dr
- 422 Afton Dr
- 520 Clover Ct
- 260 Mansell Cir
- 107 Millbrook Cir
- 7519 Saint Charles Square
- 7519 Saint Charles Square Unit 1
- 7301 Saint Charles Square
- 7301 Saint Charles Square Unit B8
- 7517 Saint Charles Square
- 7303 Saint Charles Square
- 7303 Saint Charles Square Unit B7
- 7515 Saint Charles Square
- 7305 Saint Charles Square
- 111 Millbrook Cir
- 7513 Saint Charles Square
- 7307 Saint Charles Square Unit B5
- 7511 Saint Charles Square Unit C5
- 7309 Saint Charles Square
- 7509 Saint Charles Square
- 1511 Saint Charles Square
- 7311 Saint Charles Square
- 7311 Saint Charles Square Unit 7311
- 113 Millbrook Cir