Estimated Value: $60,000 - $90,000
3
Beds
1
Bath
1,080
Sq Ft
$72/Sq Ft
Est. Value
About This Home
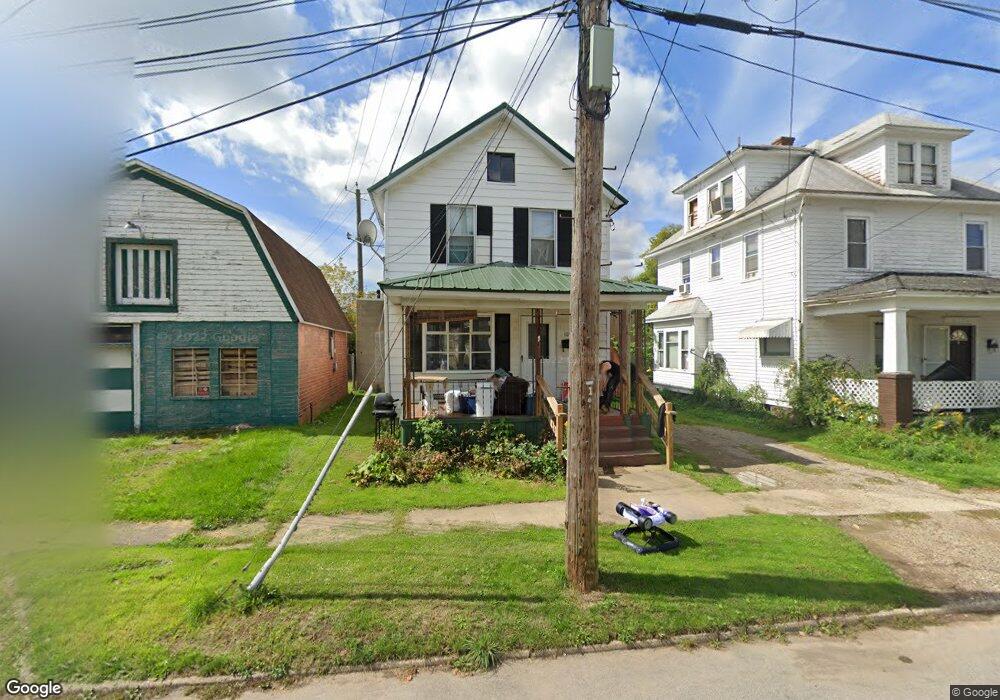
This home is located at 109 N 11th St, Olean, NY 14760 and is currently estimated at $77,449, approximately $71 per square foot. 109 N 11th St is a home located in Cattaraugus County with nearby schools including Olean Intermediate-Middle School, Olean Senior High School, and Southern Tier Catholic School.
Ownership History
Date
Name
Owned For
Owner Type
Purchase Details
Closed on
Sep 27, 2018
Sold by
Abbott Samantha V R
Bought by
Barlett Susan
Current Estimated Value
Purchase Details
Closed on
Sep 21, 2018
Sold by
Abbott Samantha V R
Bought by
Barlett Susan
Purchase Details
Closed on
Sep 12, 2018
Sold by
Abbott Samantha V
Bought by
Barlett Susan
Purchase Details
Closed on
Jun 11, 2013
Sold by
Estate Of Patricia Lally F & K
Bought by
Abbott Samantha V.R.
Create a Home Valuation Report for This Property
The Home Valuation Report is an in-depth analysis detailing your home's value as well as a comparison with similar homes in the area
Home Values in the Area
Average Home Value in this Area
Purchase History
| Date | Buyer | Sale Price | Title Company |
|---|---|---|---|
| Barlett Susan | $17,000 | None Available | |
| Barlett Susan | $17,000 | None Available | |
| Barlett Susan | -- | -- | |
| Abbott Samantha V.R. | $14,500 | Jeffrey Reisner |
Source: Public Records
Tax History
| Year | Tax Paid | Tax Assessment Tax Assessment Total Assessment is a certain percentage of the fair market value that is determined by local assessors to be the total taxable value of land and additions on the property. | Land | Improvement |
|---|---|---|---|---|
| 2024 | $1,581 | $25,000 | $700 | $24,300 |
| 2023 | $941 | $25,000 | $700 | $24,300 |
| 2022 | $955 | $25,000 | $700 | $24,300 |
| 2021 | $982 | $25,000 | $700 | $24,300 |
| 2020 | $989 | $25,000 | $700 | $24,300 |
| 2019 | $375 | $25,000 | $700 | $24,300 |
| 2018 | $748 | $25,000 | $700 | $24,300 |
| 2017 | $401 | $25,000 | $700 | $24,300 |
| 2016 | $394 | $25,000 | $700 | $24,300 |
| 2015 | -- | $25,000 | $700 | $24,300 |
| 2014 | -- | $25,000 | $700 | $24,300 |
Source: Public Records
Map
Nearby Homes
Your Personal Tour Guide
Ask me questions while you tour the home.