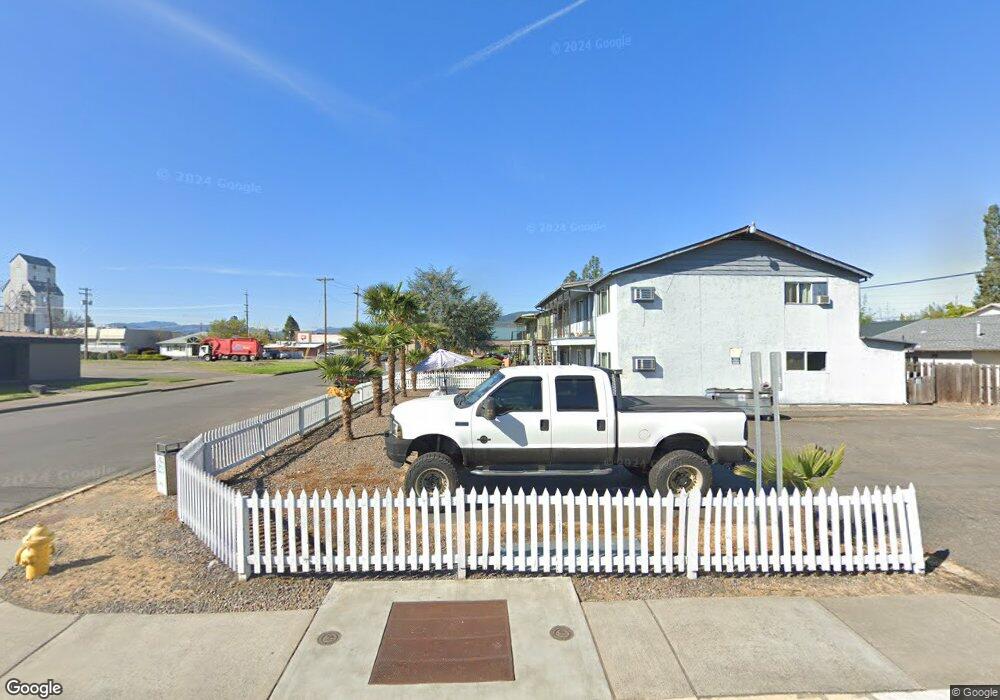
109 N 2nd St Central Point, OR 97502
Estimated Value: $400,000 - $410,696
3
Beds
2
Baths
1,407
Sq Ft
$288/Sq Ft
Est. Value
About This Home
This home is located at 109 N 2nd St, Central Point, OR 97502 and is currently estimated at $405,424, approximately $288 per square foot. 109 N 2nd St is a home located in Jackson County with nearby schools including Jewett Elementary School, Scenic Middle School, and Crater High School.
Ownership History
Date
Name
Owned For
Owner Type
Purchase Details
Closed on
Sep 5, 2025
Sold by
Charlotte J Edwards Living Trust and Edwards Stewart R
Bought by
Lichtenstein Antoinette and Lichtenstein Matthew
Current Estimated Value
Home Financials for this Owner
Home Financials are based on the most recent Mortgage that was taken out on this home.
Original Mortgage
$315,500
Outstanding Balance
$315,500
Interest Rate
6.74%
Mortgage Type
New Conventional
Estimated Equity
$89,924
Purchase Details
Closed on
Feb 5, 2018
Sold by
Edwards Charlotte J and Edwards Charlotte
Bought by
Charlotte J Edwards Living Trust and Edwards
Purchase Details
Closed on
Jan 29, 2018
Sold by
Edwards Charlotte and Edwards Charlotte J
Bought by
Edwards Charlotte J and The Charlotte J Edwards Living Trust
Create a Home Valuation Report for This Property
The Home Valuation Report is an in-depth analysis detailing your home's value as well as a comparison with similar homes in the area
Home Values in the Area
Average Home Value in this Area
Purchase History
| Date | Buyer | Sale Price | Title Company |
|---|---|---|---|
| Lichtenstein Antoinette | $405,500 | Ticor Title | |
| Charlotte J Edwards Living Trust | -- | None Listed On Document | |
| Edwards Charlotte J | -- | None Available |
Source: Public Records
Mortgage History
| Date | Status | Borrower | Loan Amount |
|---|---|---|---|
| Open | Lichtenstein Antoinette | $315,500 |
Source: Public Records
Tax History Compared to Growth
Tax History
| Year | Tax Paid | Tax Assessment Tax Assessment Total Assessment is a certain percentage of the fair market value that is determined by local assessors to be the total taxable value of land and additions on the property. | Land | Improvement |
|---|---|---|---|---|
| 2025 | $3,474 | $222,240 | $76,130 | $146,110 |
| 2024 | $3,474 | $215,770 | $73,920 | $141,850 |
| 2023 | $3,365 | $209,490 | $71,760 | $137,730 |
| 2022 | $3,276 | $209,490 | $71,760 | $137,730 |
| 2021 | $3,245 | $203,390 | $69,670 | $133,720 |
| 2020 | $3,145 | $197,470 | $67,640 | $129,830 |
| 2019 | $3,061 | $186,140 | $63,760 | $122,380 |
| 2018 | $3,223 | $180,720 | $61,910 | $118,810 |
| 2017 | $3,049 | $180,720 | $61,910 | $118,810 |
| 2016 | $2,956 | $170,350 | $58,350 | $112,000 |
| 2015 | $2,838 | $170,350 | $58,350 | $112,000 |
| 2014 | $2,725 | $160,580 | $55,000 | $105,580 |
Source: Public Records
Map
Nearby Homes