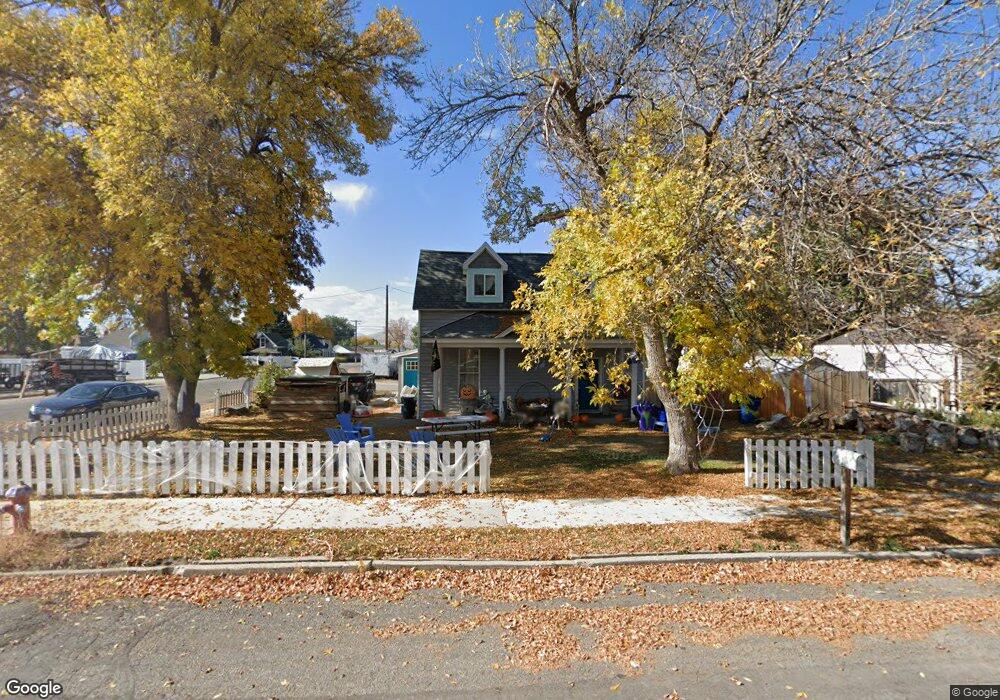
109 N 400 W Payson, UT 84651
Estimated Value: $368,553 - $404,000
3
Beds
1
Bath
1,367
Sq Ft
$278/Sq Ft
Est. Value
About This Home
This home is located at 109 N 400 W, Payson, UT 84651 and is currently estimated at $379,638, approximately $277 per square foot. 109 N 400 W is a home located in Utah County with nearby schools including Taylor Elementary School, Mt. Nebo Junior High School, and Salem Junior High School.
Ownership History
Date
Name
Owned For
Owner Type
Purchase Details
Closed on
Feb 1, 2010
Sold by
Household Finance Corporation Iii
Bought by
Peacock Layne R and Peacock Carrie M
Current Estimated Value
Home Financials for this Owner
Home Financials are based on the most recent Mortgage that was taken out on this home.
Original Mortgage
$115,260
Outstanding Balance
$76,283
Interest Rate
5.03%
Mortgage Type
New Conventional
Estimated Equity
$303,355
Purchase Details
Closed on
Jul 28, 2009
Sold by
Williams Russell Valen and Williams Ann Marie
Bought by
Household Finance Corporation Iii
Create a Home Valuation Report for This Property
The Home Valuation Report is an in-depth analysis detailing your home's value as well as a comparison with similar homes in the area
Home Values in the Area
Average Home Value in this Area
Purchase History
| Date | Buyer | Sale Price | Title Company |
|---|---|---|---|
| Peacock Layne R | -- | Backman Ntp | |
| Household Finance Corporation Iii | $101,920 | Inwest Title Services Sal |
Source: Public Records
Mortgage History
| Date | Status | Borrower | Loan Amount |
|---|---|---|---|
| Open | Peacock Layne R | $115,260 |
Source: Public Records
Tax History Compared to Growth
Tax History
| Year | Tax Paid | Tax Assessment Tax Assessment Total Assessment is a certain percentage of the fair market value that is determined by local assessors to be the total taxable value of land and additions on the property. | Land | Improvement |
|---|---|---|---|---|
| 2025 | $1,648 | $176,000 | $135,500 | $184,500 |
| 2024 | $1,648 | $167,695 | $0 | $0 |
| 2023 | $1,649 | $168,300 | $0 | $0 |
| 2022 | $1,639 | $174,075 | $0 | $0 |
| 2021 | $1,470 | $236,600 | $88,900 | $147,700 |
| 2020 | $1,361 | $214,300 | $77,300 | $137,000 |
| 2019 | $1,169 | $188,700 | $69,600 | $119,100 |
| 2018 | $1,043 | $162,300 | $58,700 | $103,600 |
| 2017 | $969 | $81,070 | $0 | $0 |
| 2016 | $901 | $74,910 | $0 | $0 |
| 2015 | $807 | $66,660 | $0 | $0 |
| 2014 | $776 | $64,515 | $0 | $0 |
Source: Public Records
Map
Nearby Homes