Estimated Value: $599,000 - $624,889
5
Beds
4
Baths
3,690
Sq Ft
$166/Sq Ft
Est. Value
About This Home
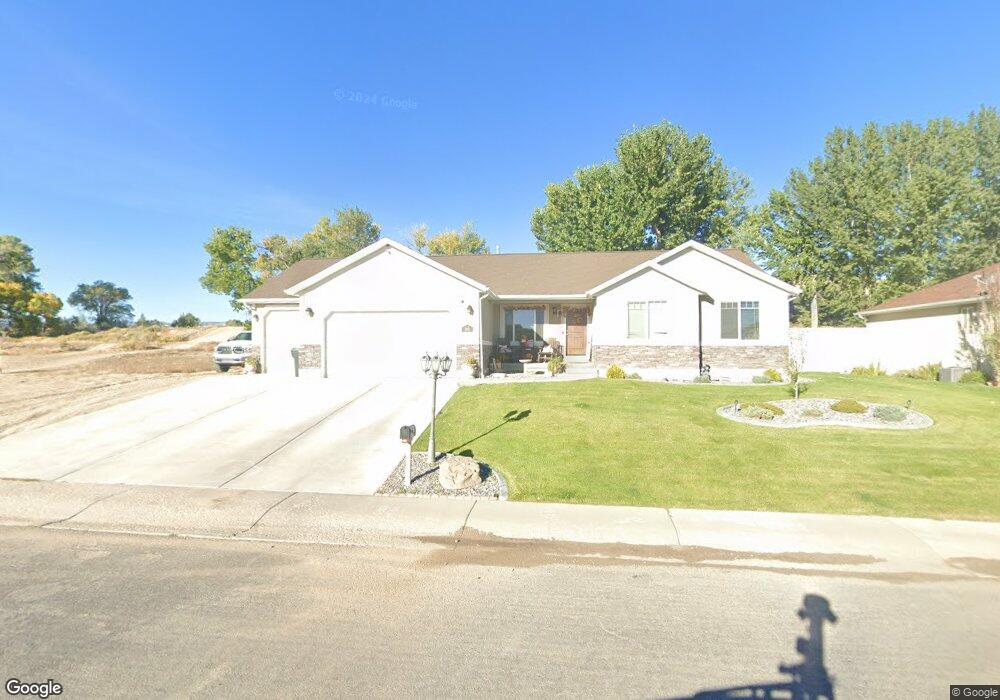
This home is located at 109 N Balsam Way, Price, UT 84501 and is currently estimated at $611,972, approximately $165 per square foot. 109 N Balsam Way is a home located in Carbon County with nearby schools including Creekview School, Mont Harmon Junior High School, and Carbon High School.
Ownership History
Date
Name
Owned For
Owner Type
Purchase Details
Closed on
Sep 25, 2020
Sold by
Wayman Christopher D
Bought by
Wayman Christopher D and Wayman Jessica
Current Estimated Value
Home Financials for this Owner
Home Financials are based on the most recent Mortgage that was taken out on this home.
Original Mortgage
$327,750
Outstanding Balance
$290,195
Interest Rate
2.9%
Mortgage Type
New Conventional
Estimated Equity
$321,777
Purchase Details
Closed on
Dec 20, 2018
Sold by
Bt Lots Llc
Bought by
Winchester Colin Reed and Winchester Rebecca Ann
Home Financials for this Owner
Home Financials are based on the most recent Mortgage that was taken out on this home.
Original Mortgage
$296,000
Interest Rate
4.9%
Mortgage Type
New Conventional
Purchase Details
Closed on
Nov 28, 2008
Sold by
Torgerson Robert O and Torgerson Faye M
Bought by
Bt Lots Llc
Create a Home Valuation Report for This Property
The Home Valuation Report is an in-depth analysis detailing your home's value as well as a comparison with similar homes in the area
Home Values in the Area
Average Home Value in this Area
Purchase History
| Date | Buyer | Sale Price | Title Company |
|---|---|---|---|
| Wayman Christopher D | -- | Professional Title Services | |
| Wayman Christopher D | -- | Professional Title Services | |
| Winchester Colin Reed | -- | Professional Title Services | |
| Bt Lots Llc | -- | Professional Title Services |
Source: Public Records
Mortgage History
| Date | Status | Borrower | Loan Amount |
|---|---|---|---|
| Open | Wayman Christopher D | $327,750 | |
| Previous Owner | Winchester Colin Reed | $296,000 |
Source: Public Records
Tax History Compared to Growth
Tax History
| Year | Tax Paid | Tax Assessment Tax Assessment Total Assessment is a certain percentage of the fair market value that is determined by local assessors to be the total taxable value of land and additions on the property. | Land | Improvement |
|---|---|---|---|---|
| 2025 | $4,068 | $314,944 | $23,157 | $291,787 |
| 2024 | $4,144 | $326,442 | $27,390 | $299,052 |
| 2023 | $4,224 | $359,373 | $38,192 | $321,181 |
| 2022 | $4,132 | $311,170 | $38,192 | $272,978 |
| 2021 | $3,819 | $456,261 | $56,000 | $400,261 |
| 2020 | $3,057 | $183,132 | $0 | $0 |
| 2019 | $2,231 | $163,447 | $0 | $0 |
| 2018 | $825 | $62,180 | $0 | $0 |
| 2017 | $678 | $51,800 | $0 | $0 |
| 2016 | $606 | $51,800 | $0 | $0 |
| 2015 | $606 | $51,800 | $0 | $0 |
| 2014 | $597 | $51,800 | $0 | $0 |
| 2013 | $602 | $51,800 | $0 | $0 |
Source: Public Records
Map
Nearby Homes
- 109 N 1470 (Balsam Way) W
- 126 N Balsam Way
- 1335 W Evergreen Dr
- 1189 W 290 N
- 1511 W Gordon Creek Rd
- 420 N Josephine Ln W
- 401 N Fairgrounds Rd
- 830 N 2140 W
- 2 Hilltop
- 495 S Fairgrounds Rd
- 275 N 500 W
- 702 W 1150 N Unit 4
- 670 W 1150 N
- 1643 N Mountain States Rd
- 7700 Us Highway 6
- 82 W 200 N
- 280 W 500 S
- 260 W 500 S
- 240 N Carbon Ave
- 328 S Carbon Ave
- 109 N 1470 W
- 127 N Balsam Way
- 108 N Balsam Way
- 90 N Balsam Way
- 72 N Balsam Way
- 107 N Evergreen Dr
- 146 N 1470 W
- 125 N 1400 W
- 89 N Evergreen Dr
- 54 N Balsam Way
- 71 N Evergreen Dr
- 145 N 1400 W
- 164 N Balsam Way
- 37 N Balsam Way
- 1420 W Box Elder Ln
- 110 N Evergreen Dr
- 163 N 1400 W
- 92 N 1400 W
- 185 N 1470 W
- 128 N Evergreen Dr