Estimated Value: $116,000 - $135,000
2
Beds
2
Baths
1,346
Sq Ft
$93/Sq Ft
Est. Value
About This Home
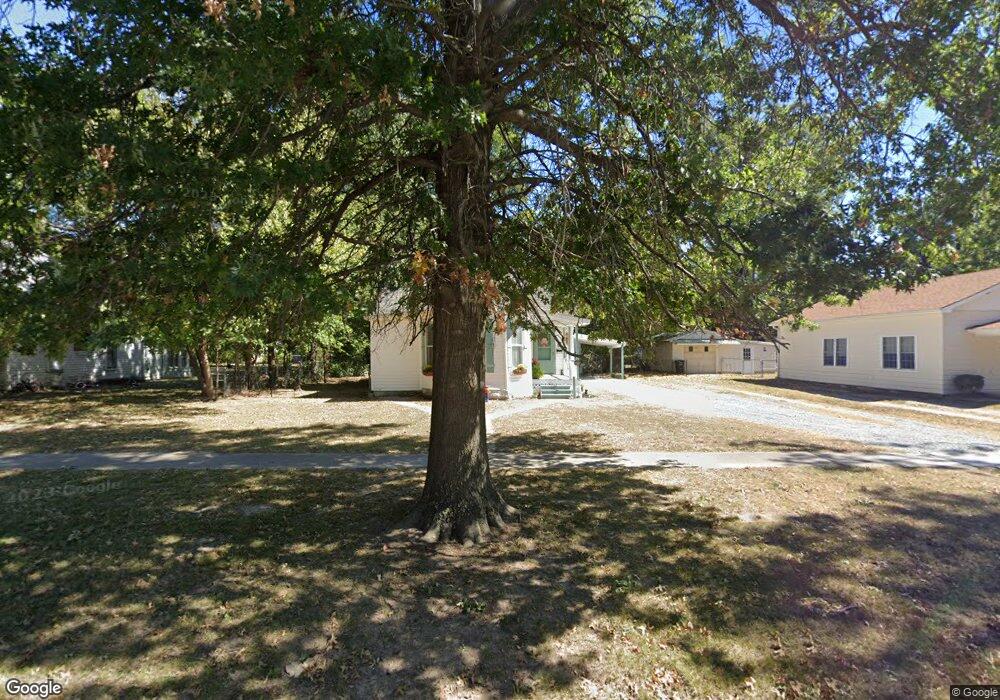
This home is located at 109 N Coo Y Yah St, Pryor, OK 74361 and is currently estimated at $125,770, approximately $93 per square foot. 109 N Coo Y Yah St is a home located in Mayes County with nearby schools including Pryor Middle School, Pryor High School, and William Bradford Christian School.
Ownership History
Date
Name
Owned For
Owner Type
Purchase Details
Closed on
Sep 5, 2012
Sold by
Ruble Brenda G and Ashury Leah N
Bought by
Troyer Jodi
Current Estimated Value
Home Financials for this Owner
Home Financials are based on the most recent Mortgage that was taken out on this home.
Original Mortgage
$59,948
Outstanding Balance
$41,431
Interest Rate
3.62%
Mortgage Type
Purchase Money Mortgage
Estimated Equity
$84,339
Purchase Details
Closed on
Apr 20, 2009
Sold by
Hedgpath Marvin and Hedgpath Cheryl
Bought by
Ruble Brenda G and Asbury Leah N
Purchase Details
Closed on
Jul 10, 2008
Sold by
Dennis Velda M
Bought by
Hedgpath Marvin
Purchase Details
Closed on
Apr 12, 2000
Sold by
Timmons Hazel
Bought by
Dennis Truman and Dennis Velda
Purchase Details
Closed on
Dec 14, 1995
Sold by
Duff Betty Jane
Bought by
Timmons Roy L
Create a Home Valuation Report for This Property
The Home Valuation Report is an in-depth analysis detailing your home's value as well as a comparison with similar homes in the area
Home Values in the Area
Average Home Value in this Area
Purchase History
| Date | Buyer | Sale Price | Title Company |
|---|---|---|---|
| Troyer Jodi | $55,000 | None Available | |
| Ruble Brenda G | $46,000 | None Available | |
| Hedgpath Marvin | $26,000 | None Available | |
| Dennis Truman | $43,000 | -- | |
| Timmons Roy L | $20,000 | -- |
Source: Public Records
Mortgage History
| Date | Status | Borrower | Loan Amount |
|---|---|---|---|
| Open | Troyer Jodi | $59,948 |
Source: Public Records
Tax History Compared to Growth
Tax History
| Year | Tax Paid | Tax Assessment Tax Assessment Total Assessment is a certain percentage of the fair market value that is determined by local assessors to be the total taxable value of land and additions on the property. | Land | Improvement |
|---|---|---|---|---|
| 2025 | $499 | $6,912 | $2,564 | $4,348 |
| 2024 | $482 | $6,710 | $2,489 | $4,221 |
| 2023 | $482 | $6,514 | $2,442 | $4,072 |
| 2022 | $445 | $6,325 | $2,427 | $3,898 |
| 2021 | $434 | $6,141 | $2,403 | $3,738 |
| 2020 | $411 | $5,962 | $2,345 | $3,617 |
| 2019 | $409 | $5,788 | $2,232 | $3,556 |
| 2018 | $392 | $5,620 | $2,106 | $3,514 |
| 2017 | $379 | $5,798 | $2,106 | $3,692 |
| 2016 | $407 | $6,106 | $2,175 | $3,931 |
| 2015 | $122 | $6,106 | $2,175 | $3,931 |
| 2014 | $414 | $6,106 | $2,175 | $3,931 |
Source: Public Records
Map
Nearby Homes
- 201 N Coo Y Yah St
- 304 N Hogan St
- 319 N Hogan St
- 218 N Vann St
- 310 N Rowe St
- 201 N Indianola St
- 115 N Indianola St
- 0 N Orphan St
- 0 N 4318 Rd Unit 2522371
- 4748 N 4318 Rd
- 305 NE 5th St
- 202 N Ora St
- 107 N Orphan St
- 415 N Orphan St
- 20 S Elliott St
- 107 S Coo Y Yah St
- 7 N Ora St
- 102 S Elliott St
- 3 N Ora St
- 7 S Orphan St
- 111 N Coo Y Yah St
- 107 N Coo Y Yah St
- 113 N Coo Y Yah St
- 103 N Coo Y Yah St
- 108 N Hogan St
- 108 N Hogan St Unit A, B, C
- 110 N Hogan St
- 106 N Hogan St
- 104 N Hogan St
- 115 N Coo Y Yah St
- 108 N Coo Y Yah St
- 112 N Hogan St
- 106 N Coo Y Yah St
- 104 N Coo Y Yah St
- 101 N Coo Y Yah St
- 112 N Coo Y Yah St
- 117 N Coo Y Yah St
- 102 N Hogan St
- 409 NE 1st St
- 114 N Hogan St