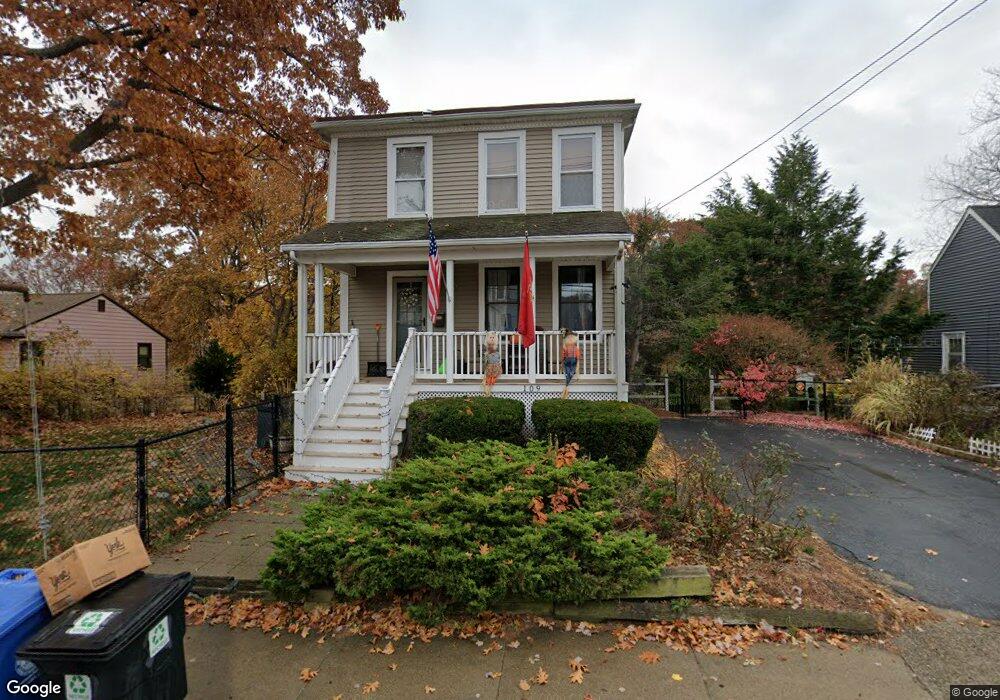
109 Nahant St Wakefield, MA 01880
East Side NeighborhoodEstimated Value: $633,000 - $742,346
3
Beds
1
Bath
1,281
Sq Ft
$531/Sq Ft
Est. Value
About This Home
This home is located at 109 Nahant St, Wakefield, MA 01880 and is currently estimated at $680,837, approximately $531 per square foot. 109 Nahant St is a home located in Middlesex County with nearby schools including Wakefield Memorial High School, St Joseph School, and Odyssey Day School.
Ownership History
Date
Name
Owned For
Owner Type
Purchase Details
Closed on
Nov 5, 2018
Sold by
Curran Paul J and Curran Lorraine A
Bought by
Curran Paul J
Current Estimated Value
Purchase Details
Closed on
Jan 20, 1984
Bought by
Curran Paul J and Curran Lorraine A
Create a Home Valuation Report for This Property
The Home Valuation Report is an in-depth analysis detailing your home's value as well as a comparison with similar homes in the area
Home Values in the Area
Average Home Value in this Area
Purchase History
| Date | Buyer | Sale Price | Title Company |
|---|---|---|---|
| Curran Paul J | -- | -- | |
| Curran Paul J | $66,000 | -- |
Source: Public Records
Mortgage History
| Date | Status | Borrower | Loan Amount |
|---|---|---|---|
| Previous Owner | Curran Paul J | $132,800 | |
| Previous Owner | Curran Paul J | $20,000 | |
| Previous Owner | Curran Paul J | $70,000 | |
| Previous Owner | Curran Paul J | $20,000 |
Source: Public Records
Tax History Compared to Growth
Tax History
| Year | Tax Paid | Tax Assessment Tax Assessment Total Assessment is a certain percentage of the fair market value that is determined by local assessors to be the total taxable value of land and additions on the property. | Land | Improvement |
|---|---|---|---|---|
| 2025 | $7,551 | $665,300 | $394,100 | $271,200 |
| 2024 | $7,076 | $629,000 | $375,600 | $253,400 |
| 2023 | $7,093 | $604,700 | $361,000 | $243,700 |
| 2022 | $6,838 | $555,000 | $331,200 | $223,800 |
| 2021 | $6,247 | $490,700 | $286,300 | $204,400 |
| 2020 | $5,955 | $466,300 | $272,100 | $194,200 |
| 2019 | $5,775 | $450,100 | $262,600 | $187,500 |
| 2018 | $5,569 | $430,000 | $250,800 | $179,200 |
| 2017 | $5,286 | $405,700 | $236,600 | $169,100 |
| 2016 | $4,931 | $365,500 | $209,100 | $156,400 |
| 2015 | $4,833 | $358,500 | $205,100 | $153,400 |
| 2014 | $4,492 | $351,500 | $201,100 | $150,400 |
Source: Public Records
Map
Nearby Homes
- 134 Nahant St Unit B
- 38 Bennett St Unit 3D
- 5 Bateman Ct Unit 5
- 199 Nahant St
- 6 Salisbury Rd
- 8 Everett St
- 9 Lilah Cir
- 22 Jefferson Rd
- 1 Sidney St
- 1 Millbrook Ln Unit 111
- 1 Millbrook Ln Unit 304
- 51 Crescent St
- 314 Water St Unit 5
- 762 Main St
- 6 Blue Jay Cir Unit 2
- 772 Main St Unit 2
- 16 Pleasant St
- 62 Foundry St Unit 310
- 62 Foundry St Unit 312
- 62 Foundry St Unit 506
- 119 Nahant St
- 114 Nahant St
- 114 Nahant St Unit 3
- 114 Nahant St Unit 2
- 114 Nahant St Unit 1
- 24 Traverse St Unit 3
- 24 Traverse St Unit 2
- 24 Traverse St Unit 1
- 122 Nahant St
- 101 Nahant St
- 101 Nahant St Unit 2
- 127 Nahant St
- 100 Nahant St
- 100 Nahant St Unit 250
- 100 Nahant St Unit 350
- 100 Nahant St Unit 400
- 100 Nahant St Unit 220
- 100 Nahant St Unit 210
- 100 Nahant St Unit 390
- 100 Nahant St