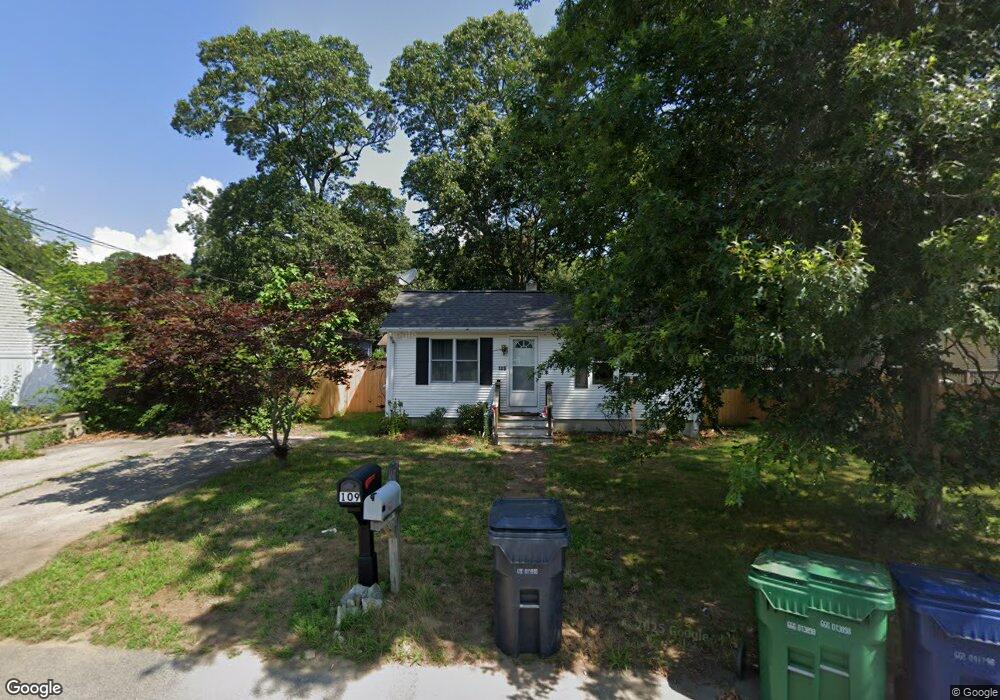
109 Northup St Warwick, RI 02889
Oakland Beach NeighborhoodEstimated Value: $289,000 - $353,000
2
Beds
1
Bath
840
Sq Ft
$379/Sq Ft
Est. Value
About This Home
This home is located at 109 Northup St, Warwick, RI 02889 and is currently estimated at $318,171, approximately $378 per square foot. 109 Northup St is a home located in Kent County with nearby schools including Saint Kevin School and Bishop Hendricken High School.
Ownership History
Date
Name
Owned For
Owner Type
Purchase Details
Closed on
Aug 27, 2015
Sold by
Lemery Linda and Ri Housing Mtg Finance
Bought by
Lemery Linda
Current Estimated Value
Purchase Details
Closed on
Dec 5, 2012
Sold by
Conley Patrick T
Bought by
Baseline Reatly
Purchase Details
Closed on
Jan 9, 2012
Sold by
Conley Patrick T and Warwick City Of
Bought by
Lemery Linda
Create a Home Valuation Report for This Property
The Home Valuation Report is an in-depth analysis detailing your home's value as well as a comparison with similar homes in the area
Home Values in the Area
Average Home Value in this Area
Purchase History
| Date | Buyer | Sale Price | Title Company |
|---|---|---|---|
| Lemery Linda | -- | -- | |
| Baseline Reatly | $7,295 | -- | |
| Lemery Linda | $2,133 | -- |
Source: Public Records
Mortgage History
| Date | Status | Borrower | Loan Amount |
|---|---|---|---|
| Previous Owner | Lemery Linda | $161,600 | |
| Previous Owner | Lemery Linda | $90,000 | |
| Previous Owner | Lemery Linda | $18,000 |
Source: Public Records
Tax History Compared to Growth
Tax History
| Year | Tax Paid | Tax Assessment Tax Assessment Total Assessment is a certain percentage of the fair market value that is determined by local assessors to be the total taxable value of land and additions on the property. | Land | Improvement |
|---|---|---|---|---|
| 2024 | $2,862 | $197,800 | $74,600 | $123,200 |
| 2023 | $2,807 | $197,800 | $74,600 | $123,200 |
| 2022 | $2,574 | $137,400 | $44,800 | $92,600 |
| 2021 | $2,574 | $137,400 | $44,800 | $92,600 |
| 2020 | $2,574 | $137,400 | $44,800 | $92,600 |
| 2019 | $2,574 | $137,400 | $44,800 | $92,600 |
| 2018 | $2,047 | $98,400 | $41,600 | $56,800 |
| 2017 | $1,992 | $98,400 | $41,600 | $56,800 |
| 2016 | $1,992 | $98,400 | $41,600 | $56,800 |
| 2015 | $2,023 | $97,500 | $46,400 | $51,100 |
| 2014 | -- | $97,500 | $46,400 | $51,100 |
| 2013 | $1,930 | $97,500 | $46,400 | $51,100 |
Source: Public Records
Map
Nearby Homes
- 108 Pinehurst Ave
- 114 Pinehurst Ave
- 101 Northup St
- 108 Northup St
- 98 Pinehurst Ave
- 120 Northup St
- 100 Northup St
- 97 Northup St
- 126 Pinehurst Ave
- 124 Northup St
- 90 Pinehurst Ave
- 91 Northup St
- 131 Northup St
- 115 John St
- 115 Pinehurst Ave
- 107 Pinehurst Ave
- 121 John St
- 94 Northup St
- 105 John St
- 125 John St