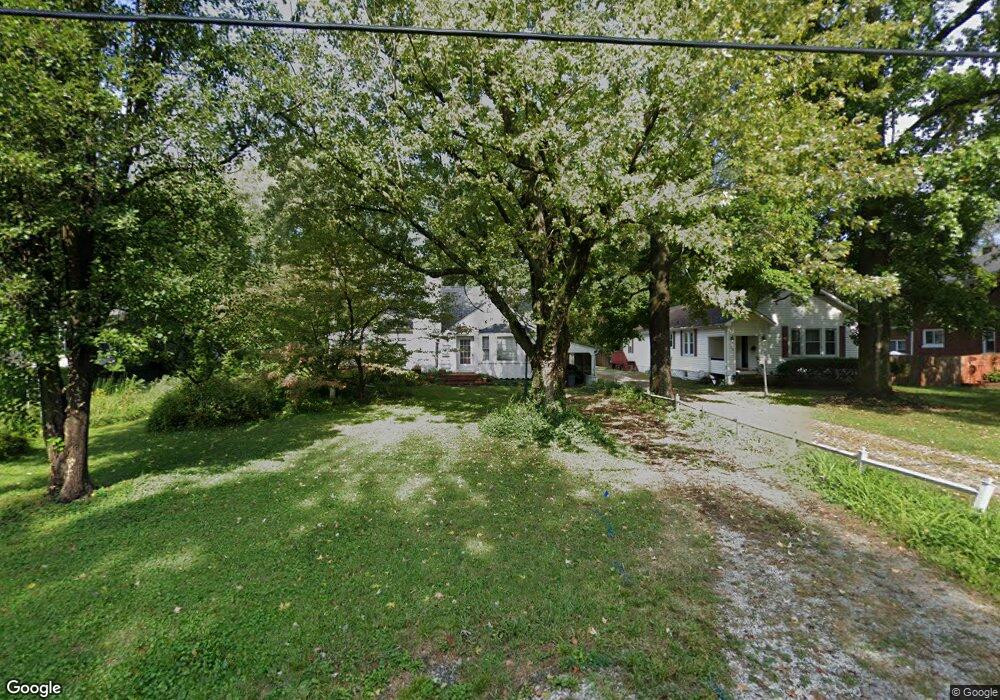
109 Orchard Dr Belleville, IL 62221
Estimated Value: $39,000 - $225,000
--
Bed
--
Bath
974
Sq Ft
$148/Sq Ft
Est. Value
About This Home
This home is located at 109 Orchard Dr, Belleville, IL 62221 and is currently estimated at $144,257, approximately $148 per square foot. 109 Orchard Dr is a home located in St. Clair County with nearby schools including Belle Valley Elementary School-North, Zion Lutheran School Belleville, and St Teresa Catholic School.
Ownership History
Date
Name
Owned For
Owner Type
Purchase Details
Closed on
Oct 9, 2025
Sold by
Buss Jason E
Bought by
Orr Christine
Current Estimated Value
Home Financials for this Owner
Home Financials are based on the most recent Mortgage that was taken out on this home.
Original Mortgage
$212,500
Outstanding Balance
$212,500
Interest Rate
6.56%
Mortgage Type
New Conventional
Estimated Equity
-$68,243
Purchase Details
Closed on
Mar 14, 2025
Sold by
Edelman Kurt and Edelman Victor
Bought by
Buss Jason E
Create a Home Valuation Report for This Property
The Home Valuation Report is an in-depth analysis detailing your home's value as well as a comparison with similar homes in the area
Home Values in the Area
Average Home Value in this Area
Purchase History
| Date | Buyer | Sale Price | Title Company |
|---|---|---|---|
| Orr Christine | $250,000 | Town & Country Title | |
| Buss Jason E | $40,000 | Town & Country Title |
Source: Public Records
Mortgage History
| Date | Status | Borrower | Loan Amount |
|---|---|---|---|
| Open | Orr Christine | $212,500 |
Source: Public Records
Tax History Compared to Growth
Tax History
| Year | Tax Paid | Tax Assessment Tax Assessment Total Assessment is a certain percentage of the fair market value that is determined by local assessors to be the total taxable value of land and additions on the property. | Land | Improvement |
|---|---|---|---|---|
| 2024 | $4,533 | $51,551 | $11,657 | $39,894 |
| 2023 | $4,495 | $47,886 | $11,426 | $36,460 |
| 2022 | $4,126 | $43,109 | $10,286 | $32,823 |
| 2021 | $3,973 | $39,851 | $9,508 | $30,343 |
| 2020 | $2,749 | $37,687 | $8,992 | $28,695 |
| 2019 | $3,010 | $40,054 | $9,007 | $31,047 |
| 2018 | $2,919 | $39,188 | $8,812 | $30,376 |
| 2017 | $1,070 | $38,913 | $8,750 | $30,163 |
| 2016 | $1,066 | $38,086 | $8,564 | $29,522 |
| 2014 | $965 | $42,093 | $15,393 | $26,700 |
| 2013 | $952 | $42,695 | $15,613 | $27,082 |
Source: Public Records
Map
Nearby Homes
- 113 Orchard Dr
- 44 Apple Tree Ln
- 2505 E Main St
- 9 N Delaware Ave
- 1828 West Blvd Unit B
- 0 Denvershire Dr
- 747 Farragut Ct
- 2000 E C St
- 1922 E C St
- 58 Shady Ln
- 2125 E B St
- 1801 E C St
- 3313 Denvershire Dr
- 325 N Delaware Ave
- 3335 Dovershire Dr
- 650 Fort Henry Rd
- 228 S Missouri Ave
- 1715 Muren Blvd
- 220 S Virginia Ave
- 1606 E Belle Ave