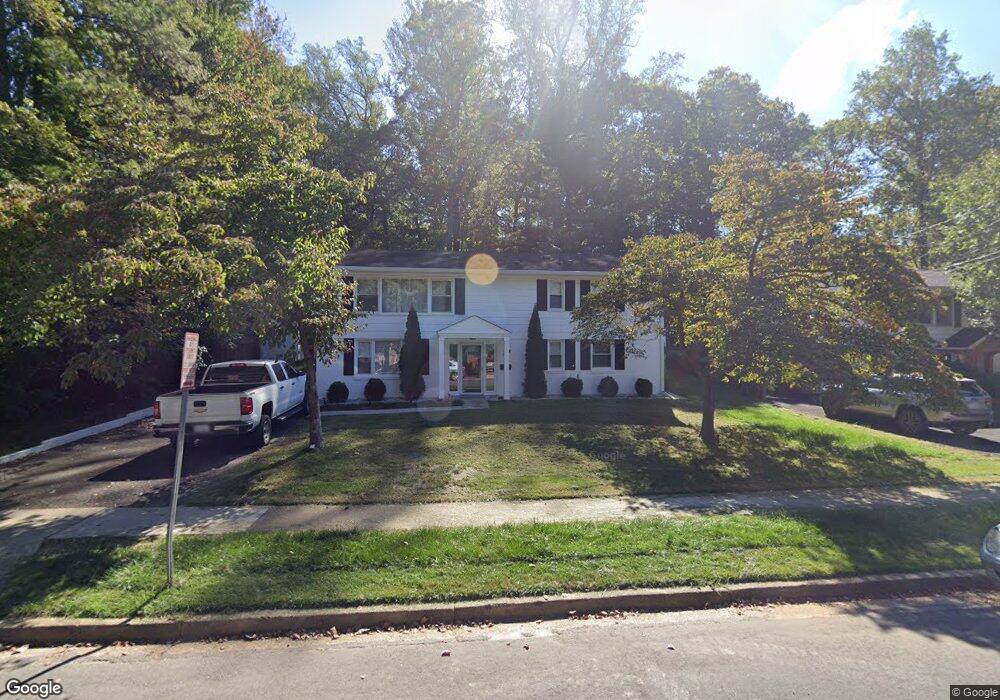
109 Patrick St SE Vienna, VA 22180
Estimated Value: $942,000 - $1,008,000
3
Beds
3
Baths
1,170
Sq Ft
$826/Sq Ft
Est. Value
About This Home
This home is located at 109 Patrick St SE, Vienna, VA 22180 and is currently estimated at $966,750, approximately $826 per square foot. 109 Patrick St SE is a home located in Fairfax County with nearby schools including Cunningham Park Elementary School, Thoreau Middle School, and Madison High.
Ownership History
Date
Name
Owned For
Owner Type
Purchase Details
Closed on
Sep 22, 2025
Sold by
Yasheng Nuerximanguli and Makatel Sayit
Bought by
Faruk Mir Omar and Parmar Bhargaviben Vinodkumar
Current Estimated Value
Home Financials for this Owner
Home Financials are based on the most recent Mortgage that was taken out on this home.
Original Mortgage
$665,000
Outstanding Balance
$665,000
Interest Rate
6.63%
Mortgage Type
New Conventional
Estimated Equity
$301,750
Purchase Details
Closed on
Jul 20, 2020
Sold by
Leslie Christopher Michael and Estate Of Ann Paula Hufziger
Bought by
Makatel Sayit and Makatel Yasheng Nuerximanguli
Home Financials for this Owner
Home Financials are based on the most recent Mortgage that was taken out on this home.
Original Mortgage
$593,750
Interest Rate
3.2%
Mortgage Type
New Conventional
Create a Home Valuation Report for This Property
The Home Valuation Report is an in-depth analysis detailing your home's value as well as a comparison with similar homes in the area
Home Values in the Area
Average Home Value in this Area
Purchase History
| Date | Buyer | Sale Price | Title Company |
|---|---|---|---|
| Faruk Mir Omar | $965,000 | Old Republic National Title | |
| Makatel Sayit | $625,000 | Old Republic Natl Ttl Ins Co |
Source: Public Records
Mortgage History
| Date | Status | Borrower | Loan Amount |
|---|---|---|---|
| Open | Faruk Mir Omar | $665,000 | |
| Previous Owner | Makatel Sayit | $593,750 |
Source: Public Records
Tax History
| Year | Tax Paid | Tax Assessment Tax Assessment Total Assessment is a certain percentage of the fair market value that is determined by local assessors to be the total taxable value of land and additions on the property. | Land | Improvement |
|---|---|---|---|---|
| 2025 | $9,255 | $835,130 | $421,000 | $414,130 |
| 2024 | $9,255 | $798,880 | $421,000 | $377,880 |
| 2023 | $8,740 | $774,450 | $401,000 | $373,450 |
| 2022 | $8,070 | $705,750 | $351,000 | $354,750 |
| 2021 | $7,686 | $654,970 | $341,000 | $313,970 |
| 2020 | $7,231 | $610,960 | $331,000 | $279,960 |
| 2019 | $7,051 | $595,810 | $331,000 | $264,810 |
| 2018 | $6,709 | $583,380 | $321,000 | $262,380 |
| 2017 | $6,485 | $558,530 | $311,000 | $247,530 |
| 2016 | $6,337 | $546,960 | $311,000 | $235,960 |
| 2015 | $5,865 | $525,510 | $311,000 | $214,510 |
| 2014 | $6,785 | $505,510 | $291,000 | $214,510 |
Source: Public Records
Map
Nearby Homes
- 125 Casmar St SE
- 131 Casmar St SE
- 109 James Dr SE
- 113 James Dr SW
- 1203 Cottage St SW
- 8642 Mchenry St
- 8650 Mchenry St
- 2633 Wooster Ct
- 1110 Hillcrest Dr SW
- 2619 Amanda Ct
- 510 Walker St SW
- 8503 Marquette St
- 406 Dove Cir SW
- 410 Dove Cir SW
- 8624 Redwood Dr
- 930 Park St SE
- 1111 Lakewood Dr SW
- 2777 Grovemore Ln
- 1212 Drake St SW
- 1105 Lakewood Dr SW
- 107 Patrick St SE
- 107 Patrick St SE
- 105 Patrick St SE
- 105 Patrick St SE
- 106 Sanoey Cir SE
- 104 Sanoey Cir SE
- 110 Patrick St SE
- 110 Patrick St SE
- 103 Patrick St SE
- 103 Patrick St SE
- 108 Patrick St SE
- 108 Patrick St SE
- 102 Sanoey Cir SE
- 114 Patrick St SE
- 106 Patrick St SE
- 106 Patrick St SE
- 105 Sanoey Cir SE
- 101 Patrick St SE
- 101 Patrick St SE
- 1402 Desale St SW
Your Personal Tour Guide
Ask me questions while you tour the home.