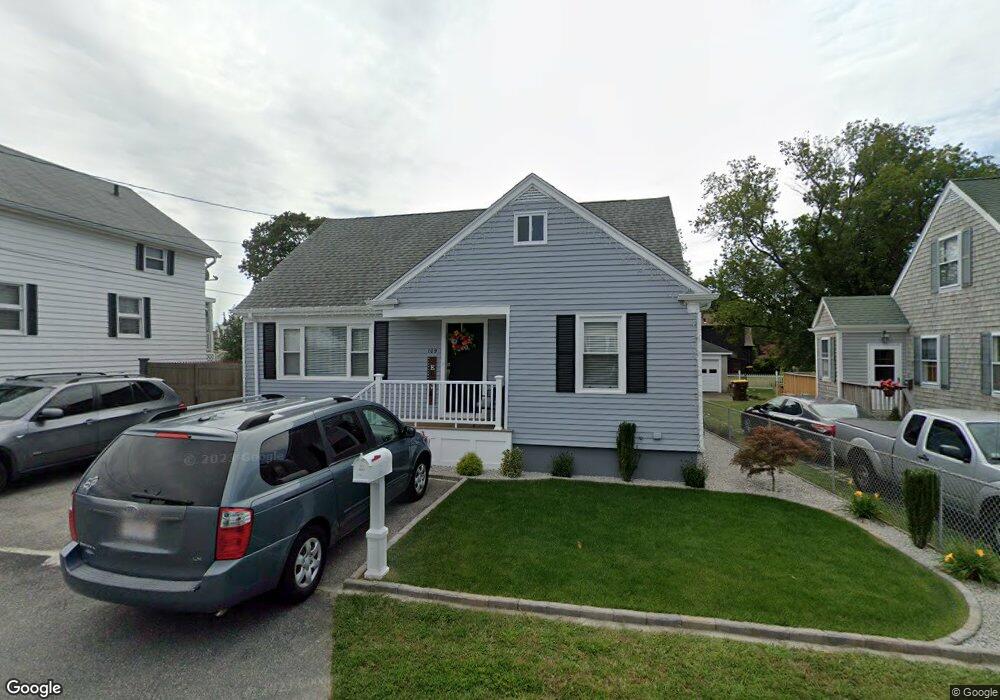
109 Pebble St Fall River, MA 02721
Maplewood NeighborhoodEstimated Value: $325,000 - $379,603
2
Beds
2
Baths
928
Sq Ft
$385/Sq Ft
Est. Value
About This Home
This home is located at 109 Pebble St, Fall River, MA 02721 and is currently estimated at $356,901, approximately $384 per square foot. 109 Pebble St is a home located in Bristol County with nearby schools including Letourneau Elementary School, Matthew J. Kuss Middle School, and B M C Durfee High School.
Ownership History
Date
Name
Owned For
Owner Type
Purchase Details
Closed on
Oct 8, 2014
Sold by
Aguiar Isabel Est
Bought by
Aguiar Carlos M
Current Estimated Value
Purchase Details
Closed on
Jul 16, 2009
Sold by
Cabral Luiz A
Bought by
Cabral Luiz A and Cabral Liduina
Purchase Details
Closed on
Mar 22, 2006
Sold by
Aguiar Isabel
Bought by
Aguiar Isabel and Cabral Luiz A
Create a Home Valuation Report for This Property
The Home Valuation Report is an in-depth analysis detailing your home's value as well as a comparison with similar homes in the area
Home Values in the Area
Average Home Value in this Area
Purchase History
| Date | Buyer | Sale Price | Title Company |
|---|---|---|---|
| Aguiar Carlos M | -- | -- | |
| Cabral Luiz A | -- | -- | |
| Aguiar Isabel | -- | -- |
Source: Public Records
Tax History
| Year | Tax Paid | Tax Assessment Tax Assessment Total Assessment is a certain percentage of the fair market value that is determined by local assessors to be the total taxable value of land and additions on the property. | Land | Improvement |
|---|---|---|---|---|
| 2025 | $3,732 | $325,900 | $125,500 | $200,400 |
| 2024 | $3,306 | $287,700 | $120,700 | $167,000 |
| 2023 | $3,205 | $261,200 | $103,500 | $157,700 |
| 2022 | $2,867 | $227,200 | $94,100 | $133,100 |
| 2021 | $4,341 | $197,300 | $87,000 | $110,300 |
| 2020 | $2,582 | $178,700 | $83,300 | $95,400 |
| 2019 | $2,500 | $171,500 | $79,300 | $92,200 |
| 2018 | $4,203 | $168,000 | $77,900 | $90,100 |
| 2017 | $4,105 | $168,000 | $79,400 | $88,600 |
| 2016 | $2,278 | $167,100 | $82,700 | $84,400 |
| 2015 | $2,146 | $164,100 | $79,700 | $84,400 |
| 2014 | $2,117 | $168,300 | $83,900 | $84,400 |
Source: Public Records
Map
Nearby Homes
Your Personal Tour Guide
Ask me questions while you tour the home.