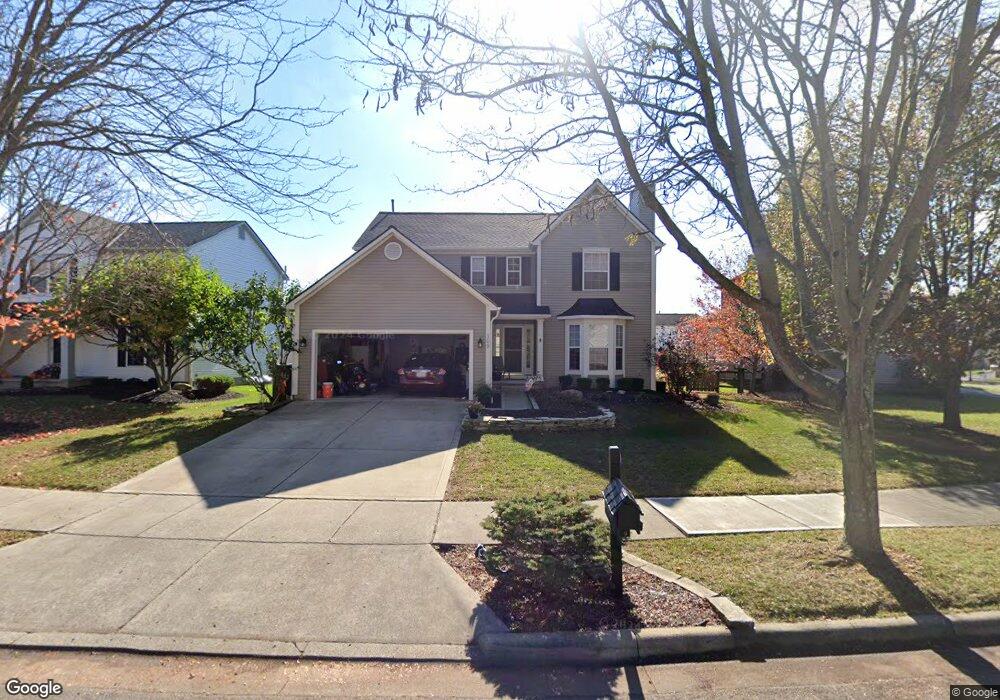
109 Persimmon Ct Delaware, OH 43015
Estimated Value: $408,935 - $449,000
4
Beds
3
Baths
2,059
Sq Ft
$206/Sq Ft
Est. Value
About This Home
This home is located at 109 Persimmon Ct, Delaware, OH 43015 and is currently estimated at $423,234, approximately $205 per square foot. 109 Persimmon Ct is a home located in Delaware County with nearby schools including Laura Woodward Elementary School, John C. Dempsey Middle School, and Rutherford B. Hayes High School.
Ownership History
Date
Name
Owned For
Owner Type
Purchase Details
Closed on
Oct 5, 2018
Sold by
Thivener Cheryl L
Bought by
Pritchard Scott W and Smith Tisha S
Current Estimated Value
Purchase Details
Closed on
Jul 6, 2010
Sold by
White Ronald H and White Diana E
Bought by
Thivener Cheryl L
Purchase Details
Closed on
Jul 28, 2004
Sold by
Search Boyd E and Search Kristin W
Bought by
White Ronald H and White Diana E
Home Financials for this Owner
Home Financials are based on the most recent Mortgage that was taken out on this home.
Original Mortgage
$193,500
Interest Rate
5.25%
Mortgage Type
Purchase Money Mortgage
Purchase Details
Closed on
Aug 29, 1997
Sold by
Dominion Homes Inc
Bought by
Boyd E & Kristin W Search
Home Financials for this Owner
Home Financials are based on the most recent Mortgage that was taken out on this home.
Original Mortgage
$159,200
Interest Rate
7.13%
Mortgage Type
New Conventional
Create a Home Valuation Report for This Property
The Home Valuation Report is an in-depth analysis detailing your home's value as well as a comparison with similar homes in the area
Home Values in the Area
Average Home Value in this Area
Purchase History
| Date | Buyer | Sale Price | Title Company |
|---|---|---|---|
| Pritchard Scott W | -- | None Available | |
| Thivener Cheryl L | $199,900 | Stewart Title Oh | |
| White Ronald H | $215,000 | Multiple | |
| Boyd E & Kristin W Search | $167,675 | -- |
Source: Public Records
Mortgage History
| Date | Status | Borrower | Loan Amount |
|---|---|---|---|
| Previous Owner | White Ronald H | $193,500 | |
| Previous Owner | Boyd E & Kristin W Search | $159,200 |
Source: Public Records
Tax History
| Year | Tax Paid | Tax Assessment Tax Assessment Total Assessment is a certain percentage of the fair market value that is determined by local assessors to be the total taxable value of land and additions on the property. | Land | Improvement |
|---|---|---|---|---|
| 2024 | $5,021 | $116,140 | $27,130 | $89,010 |
| 2023 | $5,060 | $116,140 | $27,130 | $89,010 |
| 2022 | $4,315 | $87,920 | $17,710 | $70,210 |
| 2021 | $4,411 | $87,920 | $17,710 | $70,210 |
| 2020 | $4,461 | $87,920 | $17,710 | $70,210 |
| 2019 | $4,095 | $74,620 | $16,100 | $58,520 |
| 2018 | $4,152 | $74,620 | $16,100 | $58,520 |
| 2017 | $4,112 | $62,970 | $13,300 | $49,670 |
| 2016 | $3,119 | $62,970 | $13,300 | $49,670 |
| 2015 | $3,136 | $62,970 | $13,300 | $49,670 |
| 2014 | $3,186 | $62,970 | $13,300 | $49,670 |
| 2013 | $3,204 | $62,970 | $13,300 | $49,670 |
Source: Public Records
Map
Nearby Homes
- 269 Dogwood Dr
- 70 Tabilore Loop
- 45 Elba Crt
- 144 Wagner Way
- 1410 Stratford Rd
- 113 Yorkshire Rd
- 65 Yorkshire Rd
- 1417 Missouri Ave Unit 1413M
- 45 Elba Ct
- 13 Birch Row Dr
- 19 Winter Pine Dr
- 247 Lonepine Rd
- 36 Ravine Ridge Dr
- 1211 Rivercrest Dr S Unit E
- 181 Campo St
- 980 Pollock Rd
- 102 Corsica Way
- 61 Corsica Way
- 38 Littondale Dr
- 73 Corsica Way
- 101 Persimmon Ct
- 272 Beech Dr
- 137 Persimmon Ct
- 108 Persimmon Ct
- 278 Beech Dr
- 114 Persimmon Ct
- 143 Persimmon Ct
- 126 Persimmon Ct
- 102 Persimmon Ct
- 120 Persimmon Ct
- 132 Persimmon Ct
- 284 Beech Dr
- 149 Persimmon Ct
- 138 Persimmon Ct
- 265 Beech Dr
- 259 Beech Dr
- 244 Beech Dr
- 271 Beech Dr
- 253 Beech Dr
- 144 Persimmon Ct
Your Personal Tour Guide
Ask me questions while you tour the home.