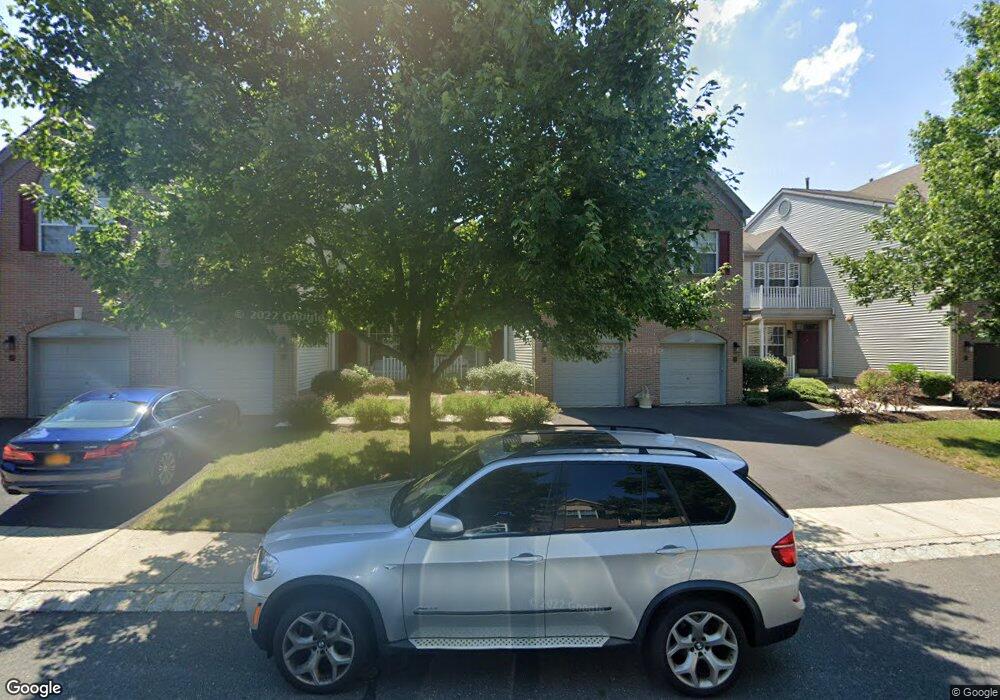
109 Persimmon Ln Holmdel, NJ 07733
Estimated Value: $636,000 - $692,000
3
Beds
3
Baths
2,145
Sq Ft
$313/Sq Ft
Est. Value
About This Home
This home is located at 109 Persimmon Ln, Holmdel, NJ 07733 and is currently estimated at $670,645, approximately $312 per square foot. 109 Persimmon Ln is a home located in Monmouth County with nearby schools including Village School, Indian Hill Elementary School, and William Satz Intermediate School.
Ownership History
Date
Name
Owned For
Owner Type
Purchase Details
Closed on
Mar 31, 2022
Sold by
Shanmugam Sankara S and Shanmugam Yamini
Bought by
Khalifa Nesrin
Current Estimated Value
Home Financials for this Owner
Home Financials are based on the most recent Mortgage that was taken out on this home.
Original Mortgage
$408,000
Outstanding Balance
$381,759
Interest Rate
3.89%
Mortgage Type
New Conventional
Estimated Equity
$288,886
Purchase Details
Closed on
Nov 20, 2013
Sold by
Bonanno Jerry S and Bonanno Rosa
Bought by
Shanmugam Sankara S
Home Financials for this Owner
Home Financials are based on the most recent Mortgage that was taken out on this home.
Original Mortgage
$324,800
Interest Rate
4.25%
Mortgage Type
New Conventional
Purchase Details
Closed on
Jan 3, 2002
Sold by
Sawicki Stanley
Bought by
Bonanno Jerry and Bonanno Rosa
Home Financials for this Owner
Home Financials are based on the most recent Mortgage that was taken out on this home.
Original Mortgage
$280,000
Interest Rate
6.72%
Purchase Details
Closed on
Dec 20, 1999
Sold by
Woods At Holmdel Llc
Bought by
Sawicki Stanley and Sawicki Young
Home Financials for this Owner
Home Financials are based on the most recent Mortgage that was taken out on this home.
Original Mortgage
$196,750
Interest Rate
7.71%
Create a Home Valuation Report for This Property
The Home Valuation Report is an in-depth analysis detailing your home's value as well as a comparison with similar homes in the area
Home Values in the Area
Average Home Value in this Area
Purchase History
| Date | Buyer | Sale Price | Title Company |
|---|---|---|---|
| Khalifa Nesrin | $510,000 | Rms Title Services | |
| Shanmugam Sankara S | $406,000 | None Available | |
| Bonanno Jerry | $350,000 | -- | |
| Sawicki Stanley | $245,990 | -- |
Source: Public Records
Mortgage History
| Date | Status | Borrower | Loan Amount |
|---|---|---|---|
| Open | Khalifa Nesrin | $408,000 | |
| Previous Owner | Shanmugam Sankara S | $324,800 | |
| Previous Owner | Bonanno Jerry | $280,000 | |
| Previous Owner | Sawicki Stanley | $196,750 |
Source: Public Records
Tax History
| Year | Tax Paid | Tax Assessment Tax Assessment Total Assessment is a certain percentage of the fair market value that is determined by local assessors to be the total taxable value of land and additions on the property. | Land | Improvement |
|---|---|---|---|---|
| 2025 | $9,090 | $608,600 | $325,000 | $283,600 |
| 2024 | $8,649 | $576,800 | $319,000 | $257,800 |
| 2023 | $8,649 | $531,600 | $290,000 | $241,600 |
| 2022 | $8,877 | $461,100 | $260,000 | $201,100 |
| 2021 | $8,877 | $442,500 | $250,000 | $192,500 |
| 2020 | $9,002 | $441,500 | $235,000 | $206,500 |
| 2019 | $8,909 | $439,100 | $225,000 | $214,100 |
| 2018 | $8,767 | $433,800 | $205,000 | $228,800 |
| 2017 | $8,514 | $419,600 | $185,000 | $234,600 |
| 2016 | $8,411 | $419,300 | $160,000 | $259,300 |
| 2015 | $7,746 | $387,500 | $150,000 | $237,500 |
| 2014 | $7,476 | $357,700 | $170,000 | $187,700 |
Source: Public Records
Map
Nearby Homes
- 14 Ambrose Ln
- 4 Pine Tree Terrace
- 424 Middlewood Rd Unit 424
- 375 Middlewood Rd
- 181 Clubhouse Dr
- 34 Michele Dr
- 22 Wellington St
- 1901 Evans Ln
- 901 Palmer Ave
- 22 Weller Place Unit 22
- 3 Beacon Ct Unit 87
- 2121 Route 35
- 42 Bonnie Dr
- 161 Cherry Tree Ln
- 123-125 Magnolia Ln
- 151 Magnolia Ln
- 3 John St Unit 118
- 22 John St
- 22 John St Unit 137
- 7 John St
- 110 Persimmon Ln
- 108 Persimmon Ln Unit 108
- 111 Persimmon Ln
- 111 Persimmon Ln Unit N111
- 107 Persimmon Ln
- 107 Persimmon Ln Unit N107
- 112 Persimmon Ln
- 113 Persimmon Ln
- 114 Persimmon Ln
- 30 Persimmon Ln
- 29 Persimmon Ln
- 29 Persimmon Ln Unit N029
- 31 Persimmon Ln
- 31 Persimmon Ln Unit N031
- 28 Persimmon Ln Unit 28
- 27 Persimmon Ln
- 26 Persimmon Ln
- 25 Persimmon Ln
- 104 Nutmeg Ln
- 105 Nutmeg Ln
Your Personal Tour Guide
Ask me questions while you tour the home.