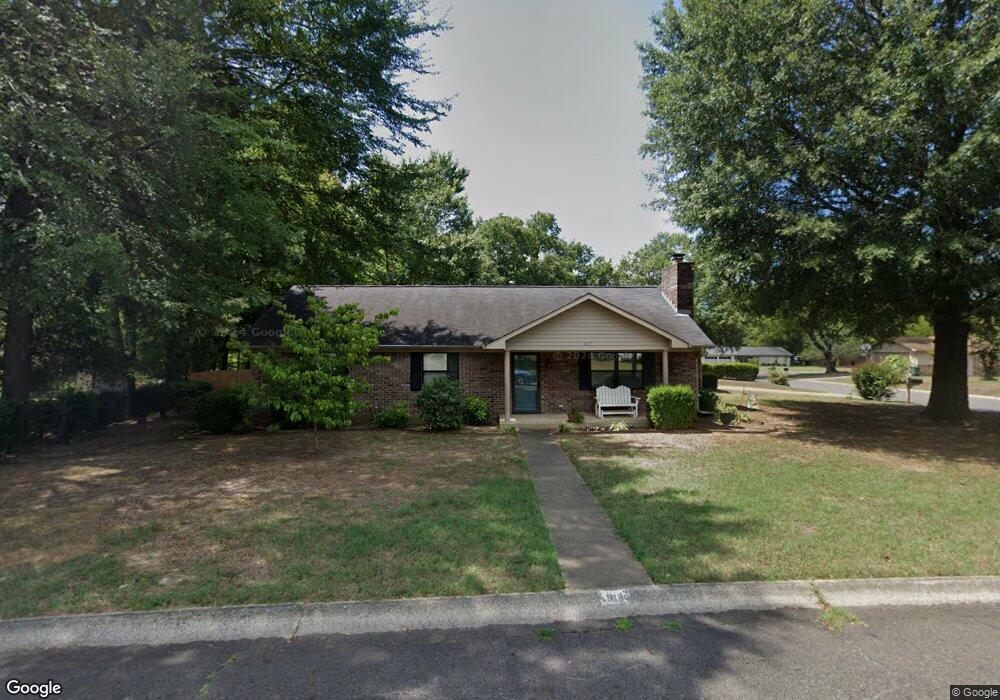
109 Pine Meadows Loop Hot Springs National Park, AR 71901
Estimated Value: $213,209 - $272,000
3
Beds
2
Baths
1,470
Sq Ft
$158/Sq Ft
Est. Value
About This Home
This home is located at 109 Pine Meadows Loop, Hot Springs National Park, AR 71901 and is currently estimated at $231,552, approximately $157 per square foot. 109 Pine Meadows Loop is a home located in Garland County with nearby schools including Lakeside Primary School, Lakeside Intermediate School, and Lakeside Junior High School.
Ownership History
Date
Name
Owned For
Owner Type
Purchase Details
Closed on
Apr 29, 2005
Sold by
Glenn Shirley Rae
Bought by
Singleton John C and Singleton Janice C
Current Estimated Value
Home Financials for this Owner
Home Financials are based on the most recent Mortgage that was taken out on this home.
Original Mortgage
$103,900
Outstanding Balance
$54,138
Interest Rate
5.93%
Mortgage Type
New Conventional
Estimated Equity
$177,414
Purchase Details
Closed on
May 19, 1998
Sold by
Not Provided
Bought by
Glenn Shirley Rae
Purchase Details
Closed on
Sep 21, 1995
Sold by
Not Provided
Bought by
Cobb Linda S
Purchase Details
Closed on
Oct 21, 1992
Sold by
Not Provided
Bought by
Vanden Heuvel Kay
Purchase Details
Closed on
Jan 1, 1901
Bought by
Shirley Philip and 525 Section Line Tr
Create a Home Valuation Report for This Property
The Home Valuation Report is an in-depth analysis detailing your home's value as well as a comparison with similar homes in the area
Home Values in the Area
Average Home Value in this Area
Purchase History
| Date | Buyer | Sale Price | Title Company |
|---|---|---|---|
| Singleton John C | $130,000 | Lenders Title Company | |
| Glenn Shirley Rae | $90,000 | -- | |
| Cobb Linda S | $85,000 | -- | |
| Vanden Heuvel Kay | $67,999 | -- | |
| Shirley Philip | -- | -- |
Source: Public Records
Mortgage History
| Date | Status | Borrower | Loan Amount |
|---|---|---|---|
| Open | Singleton John C | $103,900 | |
| Closed | Singleton John C | $25,950 |
Source: Public Records
Tax History Compared to Growth
Tax History
| Year | Tax Paid | Tax Assessment Tax Assessment Total Assessment is a certain percentage of the fair market value that is determined by local assessors to be the total taxable value of land and additions on the property. | Land | Improvement |
|---|---|---|---|---|
| 2025 | $561 | $35,760 | $1,900 | $33,860 |
| 2024 | $645 | $35,760 | $1,900 | $33,860 |
| 2023 | $720 | $35,760 | $1,900 | $33,860 |
| 2022 | $1,145 | $35,760 | $1,900 | $33,860 |
| 2021 | $1,156 | $25,750 | $1,800 | $23,950 |
| 2020 | $781 | $25,750 | $1,800 | $23,950 |
| 2019 | $781 | $25,750 | $1,800 | $23,950 |
| 2018 | $806 | $25,750 | $1,800 | $23,950 |
| 2017 | $719 | $25,750 | $1,800 | $23,950 |
| 2016 | $668 | $23,190 | $2,160 | $21,030 |
| 2015 | $608 | $23,190 | $2,160 | $21,030 |
| 2014 | $607 | $23,190 | $2,160 | $21,030 |
Source: Public Records
Map
Nearby Homes
- 103 Grayleaf Ct
- 105 Pine Meadows Loop
- 108 Pine Meadows Loop
- 102 Grayleaf Ct
- 103 Pine Meadows Loop
- 105 Grayleaf Ct
- 110 Pine Meadows Loop
- 104 Grayleaf Ct
- 106 Pine Meadows Loop
- 115 Pine Meadows Loop
- 107 Longleaf Ct
- 104 Pine Meadows
- 114 Pine Meadows Loop
- 107 Grayleaf Ct
- 102 Pine Meadows Loop
- 108 Longleaf Ct
- 106 Grayleaf Ct
- 424 Pine Meadows Loop
- 424 Pine Meadows
- 424 Pine Meadows Loop Meadows