Estimated Value: $225,000 - $249,000
3
Beds
2
Baths
1,724
Sq Ft
$136/Sq Ft
Est. Value
About This Home
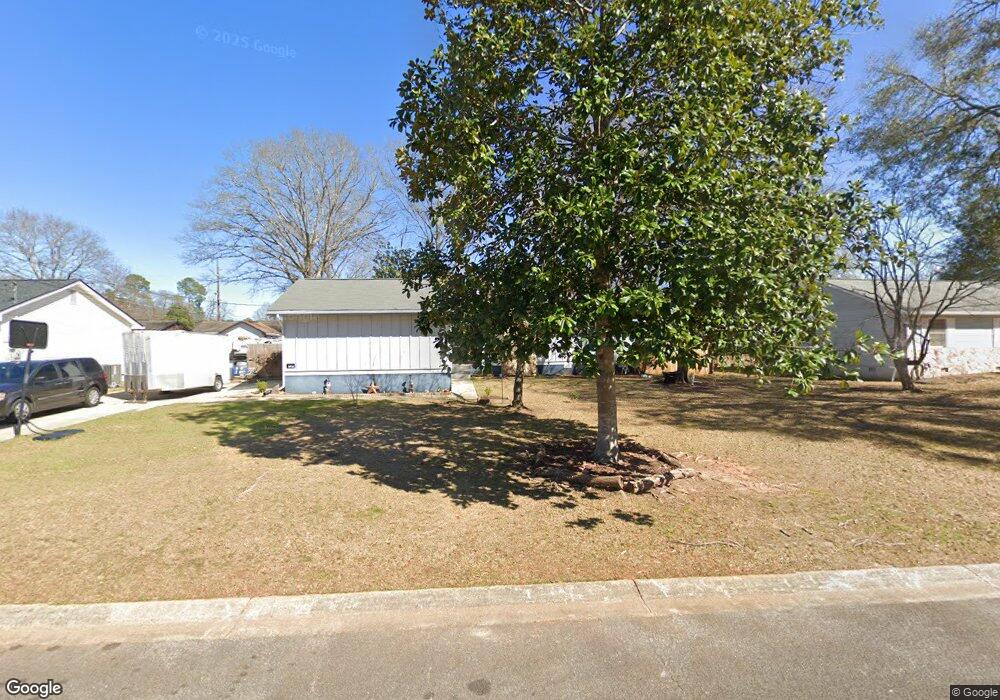
This home is located at 109 Pinewood Ct, Perry, GA 31069 and is currently estimated at $235,050, approximately $136 per square foot. 109 Pinewood Ct is a home located in Houston County with nearby schools including Tucker Elementary School, Perry Middle School, and Perry High School.
Ownership History
Date
Name
Owned For
Owner Type
Purchase Details
Closed on
Sep 30, 2021
Sold by
See Jason Christopher
Bought by
See Jason Christopher and Oldfield Amanda Marie
Current Estimated Value
Home Financials for this Owner
Home Financials are based on the most recent Mortgage that was taken out on this home.
Original Mortgage
$142,450
Outstanding Balance
$129,901
Interest Rate
2.8%
Mortgage Type
FHA
Estimated Equity
$105,149
Purchase Details
Closed on
Apr 13, 1989
Sold by
Veterans Administration
Bought by
Clay John E and Clay Karen H
Purchase Details
Closed on
Sep 6, 1988
Sold by
First Union Mortgage Corp
Bought by
Veterans Administration
Purchase Details
Closed on
Jan 20, 1987
Sold by
Malone Charles F
Bought by
Dixon Kenneth R and Dixon Jean
Purchase Details
Closed on
Dec 15, 1986
Sold by
Stewart Jimmie L and Kathleen E*
Bought by
Malone Charles F
Purchase Details
Closed on
Apr 1, 1980
Sold by
Stewart Jimmie L and Stewart Kathleen E
Bought by
Stewart Jimmie L and Kathleen E*
Purchase Details
Closed on
Aug 3, 1978
Sold by
Odom Tom Jr D and Odom B
Bought by
Stewart Jimmie L and Stewart Kathleen E
Purchase Details
Closed on
May 18, 1978
Sold by
Grisenthwaite Irma Mae
Bought by
Odom Tom Jr D and Odom B
Create a Home Valuation Report for This Property
The Home Valuation Report is an in-depth analysis detailing your home's value as well as a comparison with similar homes in the area
Home Values in the Area
Average Home Value in this Area
Purchase History
| Date | Buyer | Sale Price | Title Company |
|---|---|---|---|
| See Jason Christopher | -- | None Available | |
| See Jason Christopher | $160,000 | None Available | |
| Clay John E | -- | -- | |
| Veterans Administration | -- | -- | |
| First Union Mortgage Corp | -- | -- | |
| Dixon Kenneth R | -- | -- | |
| Malone Charles F | -- | -- | |
| Stewart Jimmie L | -- | -- | |
| Stewart Jimmie L | -- | -- | |
| Odom Tom Jr D | -- | -- |
Source: Public Records
Mortgage History
| Date | Status | Borrower | Loan Amount |
|---|---|---|---|
| Open | See Jason Christopher | $142,450 |
Source: Public Records
Tax History Compared to Growth
Tax History
| Year | Tax Paid | Tax Assessment Tax Assessment Total Assessment is a certain percentage of the fair market value that is determined by local assessors to be the total taxable value of land and additions on the property. | Land | Improvement |
|---|---|---|---|---|
| 2024 | $2,703 | $74,800 | $8,000 | $66,800 |
| 2023 | $2,285 | $63,000 | $8,000 | $55,000 |
| 2022 | $1,317 | $59,280 | $8,000 | $51,280 |
| 2021 | $1,010 | $45,680 | $8,000 | $37,680 |
| 2020 | $999 | $45,000 | $8,000 | $37,000 |
| 2019 | $999 | $45,000 | $8,000 | $37,000 |
| 2018 | $999 | $45,000 | $8,000 | $37,000 |
| 2017 | $1,000 | $45,000 | $8,000 | $37,000 |
| 2016 | $1,001 | $45,000 | $8,000 | $37,000 |
| 2015 | $1,004 | $45,000 | $8,000 | $37,000 |
| 2014 | -- | $45,000 | $8,000 | $37,000 |
| 2013 | -- | $45,000 | $8,000 | $37,000 |
Source: Public Records
Map
Nearby Homes
- 606 Frank Satterfield Rd
- 117 Constance Ct
- 118 Constance Ct
- 1432 Duncan Ave
- 1808 Ross St
- 625 Cooper St
- 1406 Main St
- 630 Pine Ridge St
- 624 Pine Ridge St
- 706 Hillcrest Ave
- 1207 Tucker Rd
- 1405 Cambridge Rd
- 903 Massee Ln
- 905 Massee Ln
- 105 Water Run Way
- 121 Pridgen Pass
- 107 Water Run Way
- 105 Pridgen Pass
- 203 Farrell Way
- 102 Pridgen Pass
- 107 Pinewood Ct
- 111 Pinewood Ct
- 611 Frank Satterfield Rd
- 613 Frank Satterfield Rd
- 609 Frank Satterfield Rd
- 105 Pinewood Ct
- 108 Pinewood Ct
- 106 Pinewood Ct
- 113 Pinewood Ct
- 110 Pinewood Ct
- 701 Frank Satterfield Rd
- 607 Frank Satterfield Rd
- 104 Pinewood Ct
- 103 Pinewood Ct
- 114 Pinewood Ct
- 102 Pinewood Ct
- 703 Frank Satterfield Rd
- 112 Pinewood Ct
- 605 Frank Satterfield Rd
- 210 Shane Cir