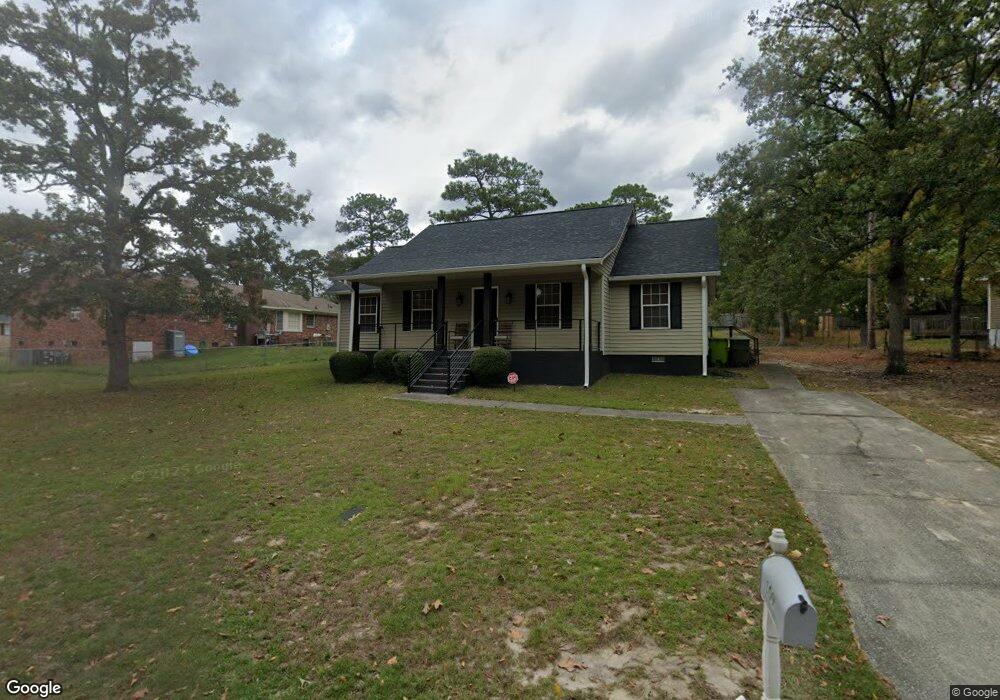
109 Pointer Dr Hopkins, SC 29061
Estimated Value: $160,000 - $211,000
3
Beds
2
Baths
1,328
Sq Ft
$143/Sq Ft
Est. Value
About This Home
This home is located at 109 Pointer Dr, Hopkins, SC 29061 and is currently estimated at $189,382, approximately $142 per square foot. 109 Pointer Dr is a home located in Richland County with nearby schools including Caughman Road Elementary School, Hopkins Middle School, and Lower Richland High School.
Ownership History
Date
Name
Owned For
Owner Type
Purchase Details
Closed on
Mar 22, 2022
Sold by
Janie Harris
Bought by
Harris Julian
Current Estimated Value
Home Financials for this Owner
Home Financials are based on the most recent Mortgage that was taken out on this home.
Original Mortgage
$85,000
Outstanding Balance
$79,629
Interest Rate
4.16%
Mortgage Type
VA
Estimated Equity
$109,753
Purchase Details
Closed on
Dec 15, 2021
Sold by
Harris Janie D and Estate Of Jocelyn Danielle Har
Bought by
Harris Janie and Harris Larry D
Purchase Details
Closed on
Apr 26, 2002
Sold by
First Horizen Home Loans Corporation
Bought by
Harris Jocelyn D
Home Financials for this Owner
Home Financials are based on the most recent Mortgage that was taken out on this home.
Original Mortgage
$74,524
Interest Rate
6.98%
Purchase Details
Closed on
Sep 18, 2001
Sold by
Carmichael Carmichael Willie J Willie J and Carmichael Tammie L
Bought by
First Horizon Home Loans Corp
Create a Home Valuation Report for This Property
The Home Valuation Report is an in-depth analysis detailing your home's value as well as a comparison with similar homes in the area
Home Values in the Area
Average Home Value in this Area
Purchase History
| Date | Buyer | Sale Price | Title Company |
|---|---|---|---|
| Harris Julian | $85,000 | None Listed On Document | |
| Harris Janie | -- | None Available | |
| Harris Jocelyn D | $76,829 | -- | |
| First Horizon Home Loans Corp | $79,000 | -- |
Source: Public Records
Mortgage History
| Date | Status | Borrower | Loan Amount |
|---|---|---|---|
| Open | Harris Julian | $85,000 | |
| Previous Owner | Harris Jocelyn D | $74,524 |
Source: Public Records
Tax History
| Year | Tax Paid | Tax Assessment Tax Assessment Total Assessment is a certain percentage of the fair market value that is determined by local assessors to be the total taxable value of land and additions on the property. | Land | Improvement |
|---|---|---|---|---|
| 2024 | $4,740 | $167,300 | $16,500 | $150,800 |
| 2023 | $4,625 | $6,000 | $0 | $0 |
| 2022 | $4,362 | $150,000 | $15,000 | $135,000 |
| 2021 | $2,694 | $5,280 | $0 | $0 |
| 2020 | $2,708 | $5,280 | $0 | $0 |
| 2019 | $2,683 | $5,280 | $0 | $0 |
| 2018 | $2,354 | $4,590 | $0 | $0 |
| 2017 | $2,290 | $4,590 | $0 | $0 |
| 2016 | $2,251 | $4,590 | $0 | $0 |
| 2015 | $2,221 | $4,590 | $0 | $0 |
| 2014 | $2,179 | $76,500 | $0 | $0 |
| 2013 | -- | $4,590 | $0 | $0 |
Source: Public Records
Map
Nearby Homes
- 3214 Ragsdale Dr
- 309 Galbra St
- 708 Bitternut Rd
- 18 Covey Ct
- 704 Quail Hills Dr
- 329 Quail Hills Dr
- 232 Osprey Ln
- 808 Quail Hills Dr
- 337 Shellnut Ave
- 148 Fox Squirrel Cir
- 359 Fox Squirrel Cir
- 2278 S Partridge Cir
- 103 Honey Tree Rd
- 2312 S Partridge Cir
- 312 Fox Squirrel Cir
- 105 Saskatoon Dr
- 126 Purple Heron Way
- 305 Melstone Dr
- 3512 Baywater Dr
- 1008 Elizabeth Cofield Rd
- 540 Pinefield Dr
- 613 Bitternut Rd
- 605 Bitternut Rd
- 536 Pinefield Dr
- 108 Pointer Dr
- 112 Pointer Dr
- 601 Bitternut Rd
- 104 Pointer Dr
- 537 Pinefield Dr
- 116 Pointer Dr
- 116 Pointer Dr
- 532 Pinefield Dr
- 100 Pointer Dr
- 612 Bitternut Rd
- 533 Bitternut Rd
- 612 Bitternut Dr
- 608 Bitternut Rd
- 120 Pointer Dr
- 604 Bitternut Rd
- 616 Bitternut Rd
Your Personal Tour Guide
Ask me questions while you tour the home.