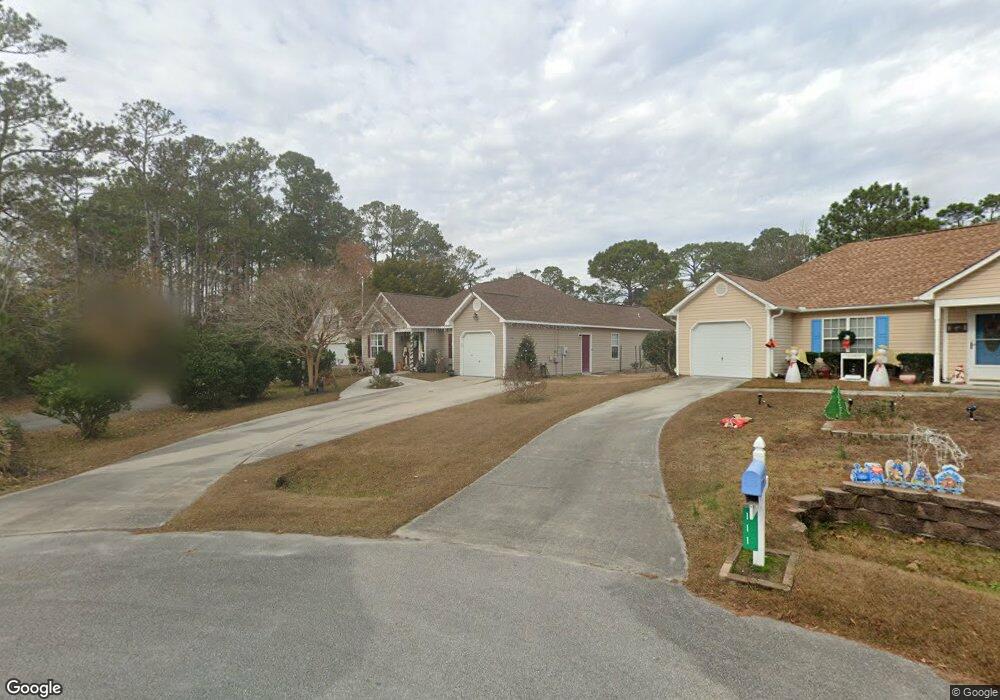
109 Post Oak Ct Hampstead, NC 28443
Estimated Value: $324,000 - $348,473
3
Beds
2
Baths
1,673
Sq Ft
$202/Sq Ft
Est. Value
About This Home
This home is located at 109 Post Oak Ct, Hampstead, NC 28443 and is currently estimated at $337,118, approximately $201 per square foot. 109 Post Oak Ct is a home located in Pender County with nearby schools including Topsail Elementary School, Topsail Middle School, and Topsail High School.
Ownership History
Date
Name
Owned For
Owner Type
Purchase Details
Closed on
Feb 9, 2024
Sold by
Thomas And Barbara Blenk Revocable Trust
Bought by
Blenk Thomas D and Blenk Barbara A
Current Estimated Value
Home Financials for this Owner
Home Financials are based on the most recent Mortgage that was taken out on this home.
Original Mortgage
$109,000
Outstanding Balance
$106,664
Interest Rate
6.66%
Mortgage Type
Credit Line Revolving
Estimated Equity
$230,454
Purchase Details
Closed on
Mar 31, 2020
Sold by
Blenk Thomas D and Blenk Barbara A
Bought by
Blenk Thomas D and Blenk Barbara A
Purchase Details
Closed on
Dec 7, 2012
Sold by
Ligotti Daniel and Ligotti Carole
Bought by
Mcdowell Jack and Mcdowell Ann
Purchase Details
Closed on
Nov 12, 2002
Bought by
Blenk Thomas D
Create a Home Valuation Report for This Property
The Home Valuation Report is an in-depth analysis detailing your home's value as well as a comparison with similar homes in the area
Home Values in the Area
Average Home Value in this Area
Purchase History
| Date | Buyer | Sale Price | Title Company |
|---|---|---|---|
| Blenk Thomas D | -- | None Listed On Document | |
| Blenk Thomas D | -- | None Listed On Document | |
| Blenk Thomas D | -- | None Available | |
| Mcdowell Jack | $175,000 | None Available | |
| Blenk Thomas D | $125,000 | -- |
Source: Public Records
Mortgage History
| Date | Status | Borrower | Loan Amount |
|---|---|---|---|
| Open | Blenk Thomas D | $109,000 | |
| Closed | Blenk Thomas D | $109,000 |
Source: Public Records
Tax History
| Year | Tax Paid | Tax Assessment Tax Assessment Total Assessment is a certain percentage of the fair market value that is determined by local assessors to be the total taxable value of land and additions on the property. | Land | Improvement |
|---|---|---|---|---|
| 2025 | $1,969 | $320,108 | $73,740 | $246,368 |
| 2024 | $1,969 | $191,231 | $29,509 | $161,722 |
| 2023 | $18 | $191,231 | $29,509 | $161,722 |
| 2022 | $1,812 | $191,231 | $29,509 | $161,722 |
| 2021 | $1,812 | $191,231 | $29,509 | $161,722 |
| 2020 | $1,812 | $191,231 | $29,509 | $161,722 |
| 2019 | $1,812 | $191,231 | $29,509 | $161,722 |
| 2018 | $1,851 | $186,971 | $60,000 | $126,971 |
| 2017 | $1,851 | $186,971 | $60,000 | $126,971 |
| 2016 | $1,756 | $186,971 | $60,000 | $126,971 |
| 2015 | $1,721 | $178,059 | $60,000 | $118,059 |
| 2014 | $1,365 | $178,059 | $60,000 | $118,059 |
| 2013 | -- | $178,059 | $60,000 | $118,059 |
| 2012 | -- | $178,059 | $60,000 | $118,059 |
Source: Public Records
Map
Nearby Homes
- 408 N Belvedere Dr
- 100 Southern Magnolia Ct
- 400 Azalea Dr
- 130 Azalea Dr
- 123 Penquin Place
- 0 Penquin Place Unit 26387277
- 702 Azalea Dr Unit 495
- 718 Azalea Dr Unit 460
- 108 Bay Tree Cir
- 724 Azalea Dr Unit 433
- 103 Holly Tree Ln
- 732 Azalea Dr Unit 406
- 124 Holly Tree Ln
- 93 Commons View Dr
- 101 Commons View Dr
- 83 Commons View Dr
- 107 Commons View Dr
- 87 Commons View Dr
- 97 Commons View Dr
- 128 S Belvedere Dr
- 111 Post Oak Ct
- 107 Post Oak Ct
- 110 Post Oak Ct
- 103 Post Oak Ct
- 108 Post Oak Ct
- 307 N Belvedere Dr
- 106 Post Oak Ct
- 104 Post Oak Ct
- 101 Post Oak Ct
- 305 N Belvedere Dr
- 104 Sweet Bay Ct
- Lot 217B N Belvedere Dr
- 0 N Belvedere Dr
- Lot 114 N Belvedere Dr
- Lot 197 N Belvedere Dr
- Lot 222 N Belvedere Dr
- 106 Sweet Bay Ct
- 102 Sweet Bay Ct
- 104 Par Ct
- 107 Yaupon Ct
Your Personal Tour Guide
Ask me questions while you tour the home.