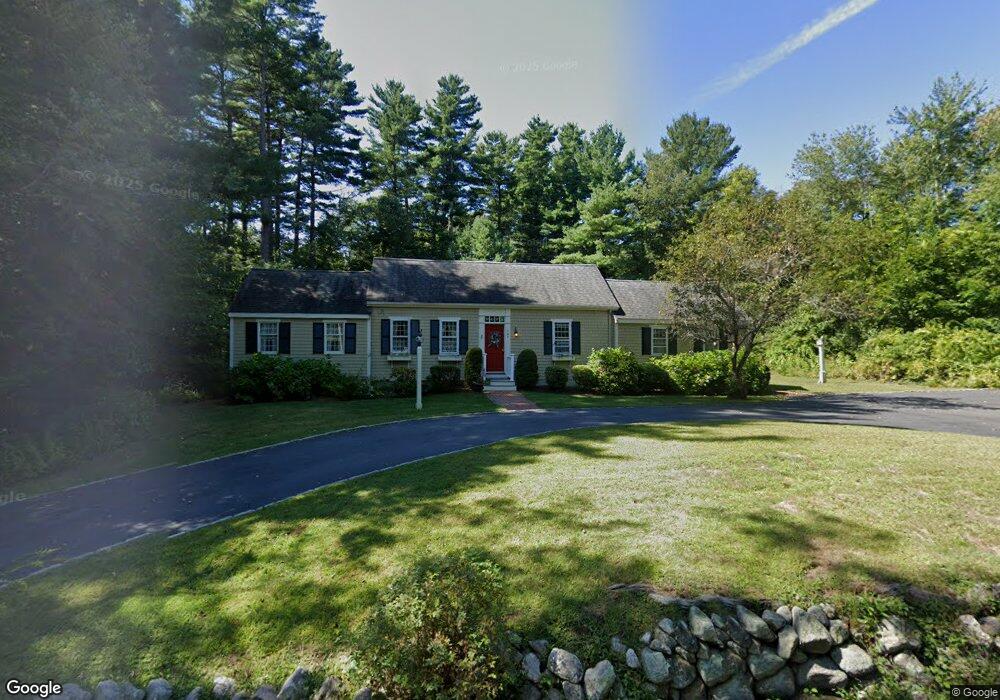
109 Prospect St Norwell, MA 02061
Estimated Value: $781,000 - $808,000
3
Beds
2
Baths
1,716
Sq Ft
$461/Sq Ft
Est. Value
About This Home
This home is located at 109 Prospect St, Norwell, MA 02061 and is currently estimated at $791,841, approximately $461 per square foot. 109 Prospect St is a home located in Plymouth County with nearby schools including Grace Farrar Cole Elementary School, Norwell Middle School, and Norwell High School.
Ownership History
Date
Name
Owned For
Owner Type
Purchase Details
Closed on
Apr 2, 2022
Sold by
Lyons John J and Lyons Susan E
Bought by
Lyons Susan E
Current Estimated Value
Purchase Details
Closed on
Jan 6, 1969
Bought by
Lyons John J and Lyons Susan E
Create a Home Valuation Report for This Property
The Home Valuation Report is an in-depth analysis detailing your home's value as well as a comparison with similar homes in the area
Home Values in the Area
Average Home Value in this Area
Purchase History
| Date | Buyer | Sale Price | Title Company |
|---|---|---|---|
| Lyons Susan E | -- | None Available | |
| Lyons John J | -- | -- |
Source: Public Records
Mortgage History
| Date | Status | Borrower | Loan Amount |
|---|---|---|---|
| Previous Owner | Lyons John J | $60,000 | |
| Previous Owner | Lyons John J | $50,000 | |
| Previous Owner | Lyons John J | $35,000 | |
| Previous Owner | Lyons John J | $40,000 |
Source: Public Records
Tax History Compared to Growth
Tax History
| Year | Tax Paid | Tax Assessment Tax Assessment Total Assessment is a certain percentage of the fair market value that is determined by local assessors to be the total taxable value of land and additions on the property. | Land | Improvement |
|---|---|---|---|---|
| 2025 | $8,109 | $620,400 | $394,000 | $226,400 |
| 2024 | $8,386 | $623,000 | $371,800 | $251,200 |
| 2023 | $7,659 | $500,900 | $286,000 | $214,900 |
| 2022 | $7,263 | $437,000 | $248,500 | $188,500 |
| 2021 | $6,998 | $413,100 | $261,600 | $151,500 |
| 2020 | $6,715 | $403,800 | $261,600 | $142,200 |
| 2019 | $6,514 | $397,200 | $261,600 | $135,600 |
| 2018 | $6,163 | $377,200 | $261,600 | $115,600 |
| 2017 | $5,664 | $344,300 | $261,600 | $82,700 |
| 2016 | $5,681 | $344,300 | $261,600 | $82,700 |
| 2015 | $5,895 | $357,300 | $261,600 | $95,700 |
| 2014 | $5,687 | $347,400 | $260,900 | $86,500 |
Source: Public Records
Map
Nearby Homes
- 114 Main St
- 225 Prospect St
- 7 Assinippi Ave Unit 216
- Lot 26 Webster Farm Way
- Lot 4 Webster Farm Way
- Lot 24 Webster Farm Way
- Lot 22 Webster Farm Way
- Lot 1 Webster Farm Way
- 433 Grove St
- 251 Prospect St
- 731 Grove St
- 179 Lincoln St
- 205 Pleasant St
- 21 Norwell Ave
- 276 Woodland Dr
- 451 Main St
- 11 Silver Brook Ln Unit 11
- 0 Mount Blue St
- 80 Coolidge Rd
- 1239 Main St