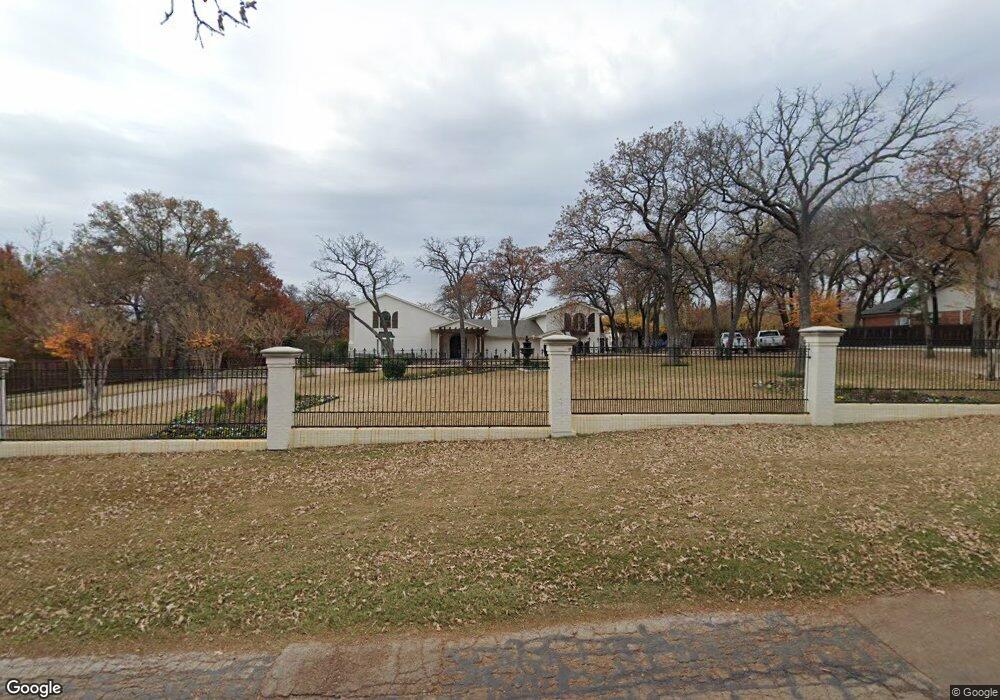
109 Quail Run Colleyville, TX 76034
Estimated Value: $1,309,000
5
Beds
6
Baths
5,603
Sq Ft
$234/Sq Ft
Est. Value
About This Home
This home is located at 109 Quail Run, Colleyville, TX 76034 and is currently estimated at $1,309,000, approximately $233 per square foot. 109 Quail Run is a home located in Tarrant County with nearby schools including Bedford Heights Elementary School, Bedford Junior High School, and L.D. Bell High School.
Ownership History
Date
Name
Owned For
Owner Type
Purchase Details
Closed on
May 2, 2019
Sold by
Martin Michael Wayne and Martin Marie Dawn
Bought by
Tbnr Properties Llc
Current Estimated Value
Purchase Details
Closed on
Nov 4, 2013
Sold by
Gerrard Robert W and Gerrard Julia D
Bought by
Martin Michael Wayne and Martin Dawn Marie
Home Financials for this Owner
Home Financials are based on the most recent Mortgage that was taken out on this home.
Original Mortgage
$660,400
Interest Rate
3.75%
Mortgage Type
Adjustable Rate Mortgage/ARM
Purchase Details
Closed on
Jul 19, 2002
Sold by
Coulson Deborah and Coulson David R
Bought by
Gerrard Robert W and Gerrard Julia D
Home Financials for this Owner
Home Financials are based on the most recent Mortgage that was taken out on this home.
Original Mortgage
$500,000
Interest Rate
6.69%
Create a Home Valuation Report for This Property
The Home Valuation Report is an in-depth analysis detailing your home's value as well as a comparison with similar homes in the area
Home Values in the Area
Average Home Value in this Area
Purchase History
| Date | Buyer | Sale Price | Title Company |
|---|---|---|---|
| Tbnr Properties Llc | -- | None Available | |
| Martin Michael Wayne | -- | None Available | |
| Gerrard Robert W | -- | American Title Co |
Source: Public Records
Mortgage History
| Date | Status | Borrower | Loan Amount |
|---|---|---|---|
| Previous Owner | Martin Michael Wayne | $660,400 | |
| Previous Owner | Gerrard Robert W | $500,000 |
Source: Public Records
Tax History Compared to Growth
Tax History
| Year | Tax Paid | Tax Assessment Tax Assessment Total Assessment is a certain percentage of the fair market value that is determined by local assessors to be the total taxable value of land and additions on the property. | Land | Improvement |
|---|---|---|---|---|
| 2025 | $17,200 | $1,185,272 | $412,560 | $772,712 |
| 2024 | $17,200 | $1,185,272 | $412,560 | $772,712 |
| 2023 | $20,061 | $1,191,767 | $412,560 | $779,207 |
| 2022 | $21,454 | $1,097,931 | $179,280 | $918,651 |
| 2021 | $23,119 | $1,105,679 | $179,280 | $926,399 |
| 2020 | $21,684 | $1,025,029 | $239,040 | $785,989 |
| 2019 | $19,646 | $909,572 | $136,000 | $773,572 |
| 2018 | $14,833 | $816,160 | $136,000 | $680,160 |
| 2017 | $16,930 | $1,003,006 | $68,000 | $935,006 |
Source: Public Records
Map
Nearby Homes
- 305 Warbler Dr
- 405 Woodbriar Ct
- 320 Blue Quail Ct
- 3713 Brentwood Ct
- 2620 Brookridge Dr
- 404 Heather Ln
- 3605 Spring Valley Dr
- 628 Huntwich Dr
- 2732 Woodbridge Dr
- 3213 Spring Valley Dr
- 2244 Hurstview Dr
- 2212 Mountainview Dr
- 909 Brestol Ct W
- 2212 Hurstview Dr
- 3609 Wayne Ct
- 432 Sunnybrook Ct
- 3119 Spring Grove Dr
- 3624 Wayne Ct
- 913 Kensington Ct
- 2668 Bent Tree Dr
- 3512 Blue Quail Ln
- 105 Quail Run
- 3508 Blue Quail Ln
- 3516 Blue Quail Ln
- 3504 Blue Quail Ln
- 108 Quail Run
- 3500 Blue Quail Ln
- 112 Quail Run
- 101 Quail Run
- 104 Quail Run
- 3513 Blue Quail Ln
- 3509 Blue Quail Ln
- 114 Quail Run
- 3517 Blue Quail Ln
- 3417 Blue Quail Ln
- 3505 Blue Quail Ln
- 208 Quail Run
- 3501 Blue Quail Ln
- 3405 San Bar Ln
- 3413 Blue Quail Ln