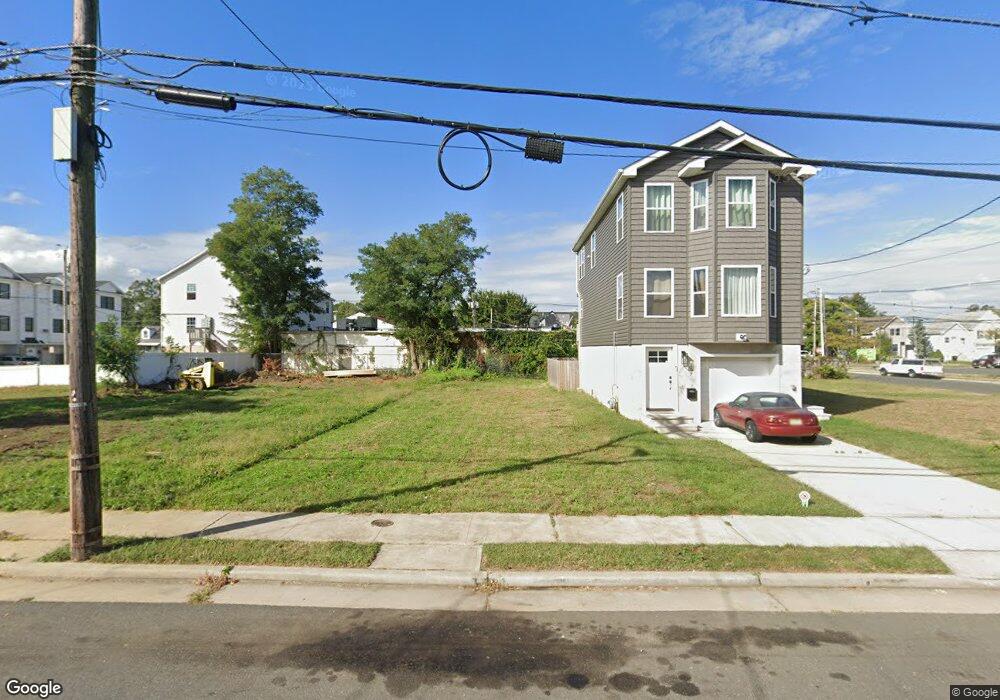
109 Raritan Ave Keansburg, NJ 07734
Estimated Value: $118,631 - $317,000
2
Beds
1
Bath
826
Sq Ft
$264/Sq Ft
Est. Value
About This Home
This home is located at 109 Raritan Ave, Keansburg, NJ 07734 and is currently estimated at $217,816, approximately $263 per square foot. 109 Raritan Ave is a home located in Monmouth County with nearby schools including Joseph C. Caruso School, Joseph R. Bolger Middle School, and Keansburg High School.
Ownership History
Date
Name
Owned For
Owner Type
Purchase Details
Closed on
Jan 14, 2009
Sold by
Consumer Solutions Reo Llc
Bought by
Samaan Magdy
Current Estimated Value
Purchase Details
Closed on
Oct 30, 2007
Sold by
Lanza Neil
Bought by
Consumer Solutions Reo Llc
Purchase Details
Closed on
Jul 12, 2006
Sold by
Bracero Frank
Bought by
Lanza Neil
Home Financials for this Owner
Home Financials are based on the most recent Mortgage that was taken out on this home.
Original Mortgage
$168,300
Interest Rate
6.67%
Mortgage Type
New Conventional
Purchase Details
Closed on
May 10, 2005
Sold by
Mccarthy Michael
Bought by
Bracero Frank
Home Financials for this Owner
Home Financials are based on the most recent Mortgage that was taken out on this home.
Original Mortgage
$19,158
Interest Rate
6.87%
Mortgage Type
Stand Alone Second
Create a Home Valuation Report for This Property
The Home Valuation Report is an in-depth analysis detailing your home's value as well as a comparison with similar homes in the area
Home Values in the Area
Average Home Value in this Area
Purchase History
| Date | Buyer | Sale Price | Title Company |
|---|---|---|---|
| Samaan Magdy | $60,000 | Golden Title Ag Llc | |
| Consumer Solutions Reo Llc | -- | None Available | |
| Lanza Neil | $187,000 | -- | |
| Bracero Frank | $127,720 | -- |
Source: Public Records
Mortgage History
| Date | Status | Borrower | Loan Amount |
|---|---|---|---|
| Previous Owner | Lanza Neil | $168,300 | |
| Previous Owner | Bracero Frank | $19,158 | |
| Previous Owner | Bracero Frank | $102,078 |
Source: Public Records
Tax History Compared to Growth
Tax History
| Year | Tax Paid | Tax Assessment Tax Assessment Total Assessment is a certain percentage of the fair market value that is determined by local assessors to be the total taxable value of land and additions on the property. | Land | Improvement |
|---|---|---|---|---|
| 2025 | -- | $174,400 | $174,400 | -- |
| 2024 | $3,033 | $162,900 | $145,000 | $17,900 |
| 2023 | $3,033 | $117,100 | $98,300 | $18,800 |
| 2022 | $2,875 | $100,200 | $81,900 | $18,300 |
| 2021 | $2,875 | $67,300 | $52,500 | $14,800 |
| 2020 | $3,242 | $80,900 | $36,300 | $44,600 |
| 2019 | $3,104 | $78,400 | $34,300 | $44,100 |
| 2018 | $2,936 | $75,100 | $32,300 | $42,800 |
| 2017 | $2,979 | $78,500 | $35,300 | $43,200 |
| 2016 | $2,968 | $81,400 | $31,300 | $50,100 |
| 2015 | $2,964 | $84,600 | $36,300 | $48,300 |
| 2014 | $3,032 | $89,100 | $46,300 | $42,800 |
Source: Public Records
Map
Nearby Homes
- 27 Gillette St
- 163 Raritan Ave
- 10 Jahn St
- 139 Seeley Ave
- 77 Center Ave
- 79 Carr Ave Unit C
- 33 Oceanview Ave
- 26 Brookside Ave
- 23 Seaview Ave
- 143 Center Ave
- 16 Bayview Ave
- 18 Braden Place
- 7 Seaview Ave
- 1 Saint Marks Place
- 9-11 Campview Ave
- 5 Oceanview Ave
- 3 Oceanview Ave
- 60 Maple Ave
- 181 Center Ave
- 4 Saint James Place
- 107 Raritan Ave
- 111 Raritan Ave
- 103 Raritan Ave Unit 105
- 117 Raritan Ave
- 126 Carr Ave
- 108 Raritan Ave
- 23 E Shore St
- 106 Raritan Ave
- 110 Raritan Ave
- 112 Raritan Ave
- 102 Raritan Ave
- 119 Raritan Ave
- 119 Raritan Ave Unit 2
- 119 Raritan Ave Unit 1
- 128 Carr Ave Unit 130
- 98 Raritan Ave Unit 100
- 24 E Shore St
- 17 Oak St
- 123 Raritan Ave
- 96 Raritan Ave