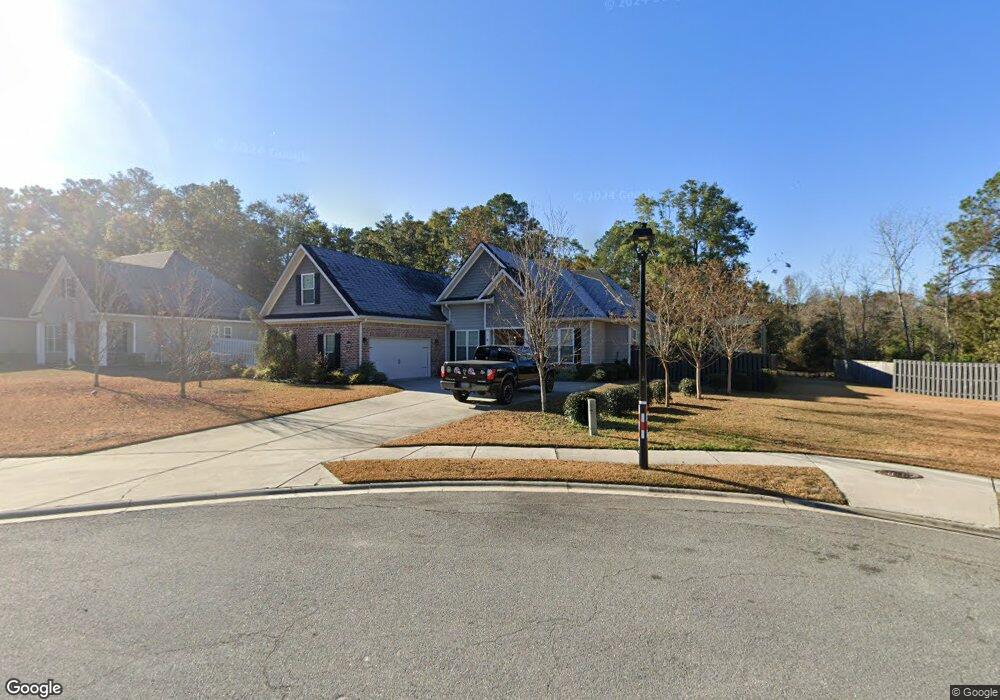
109 Red Oak Ln Unit 8 Rincon, GA 31326
Estimated Value: $511,771 - $540,000
3
Beds
3
Baths
2,774
Sq Ft
$189/Sq Ft
Est. Value
About This Home
This home is located at 109 Red Oak Ln Unit 8, Rincon, GA 31326 and is currently estimated at $524,443, approximately $189 per square foot. 109 Red Oak Ln Unit 8 is a home located in Effingham County with nearby schools including South Effingham Elementary School, South Effingham Middle School, and South Effingham High School.
Ownership History
Date
Name
Owned For
Owner Type
Purchase Details
Closed on
May 31, 2022
Sold by
Sitter Don H
Bought by
Jaworski Eric S and Jaworski Delaney N
Current Estimated Value
Home Financials for this Owner
Home Financials are based on the most recent Mortgage that was taken out on this home.
Original Mortgage
$450,000
Outstanding Balance
$428,177
Interest Rate
5.27%
Mortgage Type
VA
Estimated Equity
$96,266
Purchase Details
Closed on
Oct 2, 2017
Sold by
South Georgia Custom Homes Llc
Bought by
Sitter Don H and Sitter Vickie C
Home Financials for this Owner
Home Financials are based on the most recent Mortgage that was taken out on this home.
Original Mortgage
$209,700
Interest Rate
3.82%
Mortgage Type
New Conventional
Purchase Details
Closed on
Feb 26, 2015
Sold by
Hawk Hammock Const Llc
Bought by
South Georgia Custom Homes Llc
Purchase Details
Closed on
May 23, 1997
Bought by
Hawk Hammock Const Llc
Create a Home Valuation Report for This Property
The Home Valuation Report is an in-depth analysis detailing your home's value as well as a comparison with similar homes in the area
Home Values in the Area
Average Home Value in this Area
Purchase History
| Date | Buyer | Sale Price | Title Company |
|---|---|---|---|
| Jaworski Eric S | $450,000 | -- | |
| Sitter Don H | $262,700 | -- | |
| South Georgia Custom Homes Llc | $105,000 | -- | |
| Hawk Hammock Const Llc | -- | -- |
Source: Public Records
Mortgage History
| Date | Status | Borrower | Loan Amount |
|---|---|---|---|
| Open | Jaworski Eric S | $450,000 | |
| Previous Owner | Sitter Don H | $209,700 |
Source: Public Records
Tax History Compared to Growth
Tax History
| Year | Tax Paid | Tax Assessment Tax Assessment Total Assessment is a certain percentage of the fair market value that is determined by local assessors to be the total taxable value of land and additions on the property. | Land | Improvement |
|---|---|---|---|---|
| 2024 | $2,363 | $215,230 | $22,800 | $192,430 |
| 2023 | $2,028 | $179,702 | $20,800 | $158,902 |
| 2022 | $3,991 | $150,741 | $18,800 | $131,941 |
| 2021 | $3,724 | $125,463 | $18,000 | $107,463 |
| 2020 | $3,437 | $116,569 | $18,000 | $98,569 |
| 2019 | $3,457 | $116,569 | $18,000 | $98,569 |
| 2018 | $3,420 | $103,172 | $18,000 | $85,172 |
| 2017 | $3,623 | $110,660 | $18,000 | $92,660 |
| 2016 | $401 | $14,000 | $14,000 | $0 |
| 2015 | -- | $5,040 | $5,040 | $0 |
| 2014 | -- | $5,040 | $5,040 | $0 |
| 2013 | -- | $900 | $900 | $0 |
Source: Public Records
Map
Nearby Homes
- 206 Discovery Ln
- 143 Summer Station Dr
- 205 English Oak Dr
- 106 Gordon B Hinckley Ave
- 207 Hubener Dr
- 0 Hodgeville Rd Unit 10622997
- 0 Hodgeville Rd Unit SA341541
- 127 Fraser Ln
- 131 Fraser Ln
- 133 Fraser Ln
- 114 Fraser Ln
- 126 Fraser Ln
- 102 Mugo Way
- 105 Monterey Dr
- FREEPORT Plan at Longleaf Village
- Curtis Plan at Longleaf Village
- Hartsville Plan at Longleaf Village
- Elston Plan at Longleaf Village
- Brandon Plan at Longleaf Village
- ROBIE Plan at Longleaf Village
- 109 Red Oak Ln
- 107 Red Oak Ln
- 107 Red Oak Ln Unit 9
- 113 Red Oak Ln
- 0 Red Oak Ln Unit 8177895
- 0 Red Oak Ln Unit 7610104
- 0 Red Oak Ln Unit 7609803
- 105 Red Oak Ln Unit 10
- 105 Red Oak Ln
- 108 Red Oak Ln
- 108 Red Oak Ln Unit 5
- 1646 Goshen Rd
- 106 Red Oak Ln
- 106 Red Oak Ln Unit 4
- 110 Red Oak Ln
- 104 Red Oak Ln Unit 3
- 104 Red Oak Ln
- 103 Red Oak Ln
- 103 Red Oak Ln Unit 11
- 1676 Goshen Rd