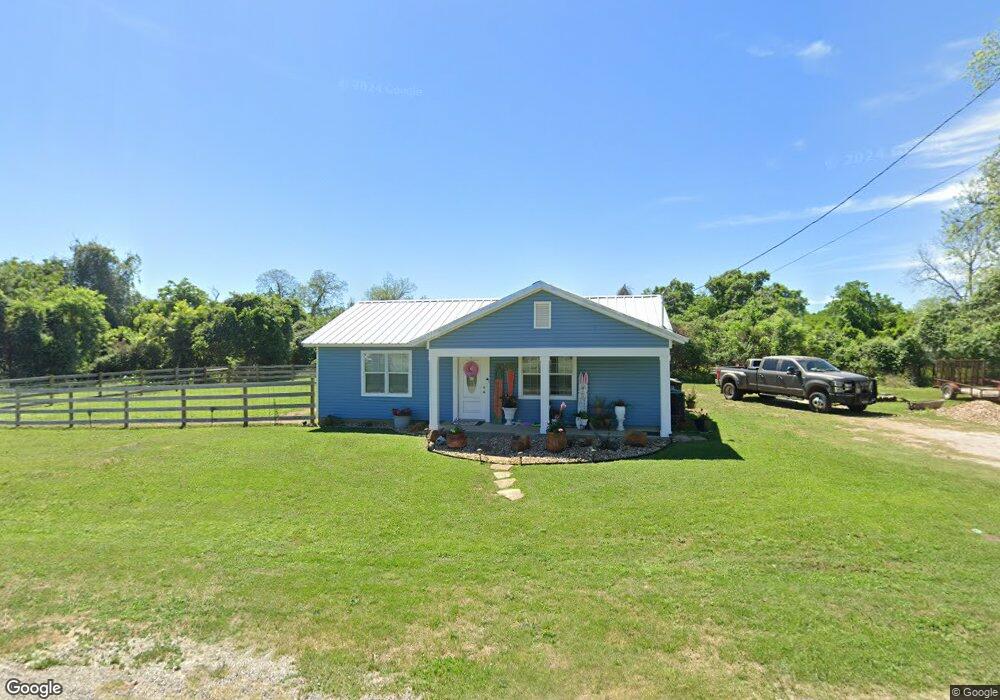
109 Robson St Columbus, TX 78934
Estimated Value: $144,788 - $196,000
--
Bed
--
Bath
925
Sq Ft
$188/Sq Ft
Est. Value
About This Home
This home is located at 109 Robson St, Columbus, TX 78934 and is currently estimated at $173,697, approximately $187 per square foot. 109 Robson St is a home located in Colorado County with nearby schools including Columbus Elementary School, Columbus Junior High School, and Columbus High School.
Ownership History
Date
Name
Owned For
Owner Type
Purchase Details
Closed on
Aug 14, 2024
Sold by
Weido Sam J and Weido Harlean H
Bought by
Weido Andrew
Current Estimated Value
Purchase Details
Closed on
Dec 26, 2023
Sold by
Stuart Hastedt Family Trust and Hastedt Stuart Whitfield
Bought by
Weido Andrew G and Green Melissa D
Purchase Details
Closed on
Dec 21, 2023
Sold by
Stuart Hastedt Family Trust
Bought by
Weido Andrew G and Green Melissa D
Purchase Details
Closed on
Mar 9, 2022
Sold by
Weido and Harlean
Bought by
Weido Andrew G and Green Melissa D
Purchase Details
Closed on
May 11, 2021
Sold by
Estate Of Frances Vivian Andreas
Bought by
Weido Sam
Create a Home Valuation Report for This Property
The Home Valuation Report is an in-depth analysis detailing your home's value as well as a comparison with similar homes in the area
Home Values in the Area
Average Home Value in this Area
Purchase History
| Date | Buyer | Sale Price | Title Company |
|---|---|---|---|
| Weido Andrew | -- | None Listed On Document | |
| Weido Andrew G | -- | None Listed On Document | |
| Weido Andrew G | -- | None Listed On Document | |
| Weido Andrew G | -- | Peters & Peters Law Firm Pllc | |
| Weido Sam | $81,000 | None Available |
Source: Public Records
Tax History Compared to Growth
Tax History
| Year | Tax Paid | Tax Assessment Tax Assessment Total Assessment is a certain percentage of the fair market value that is determined by local assessors to be the total taxable value of land and additions on the property. | Land | Improvement |
|---|---|---|---|---|
| 2024 | $1,203 | $113,440 | $36,460 | $76,980 |
| 2023 | $1,176 | $70,500 | $36,460 | $34,040 |
| 2022 | $1,231 | $67,330 | $36,460 | $30,870 |
| 2021 | $1,268 | $67,330 | $36,460 | $30,870 |
| 2020 | $1,140 | $60,200 | $13,890 | $46,310 |
| 2019 | $1,171 | $59,880 | $13,890 | $45,990 |
| 2018 | $1,547 | $78,910 | $13,890 | $65,020 |
| 2017 | $1,530 | $78,000 | $13,890 | $64,110 |
| 2016 | $1,512 | $77,080 | $13,890 | $63,190 |
| 2015 | -- | $74,790 | $13,890 | $60,900 |
| 2014 | -- | $73,420 | $13,890 | $59,530 |
Source: Public Records
Map
Nearby Homes