109 Ronald Tharrington Rd Louisburg, NC 27549
Estimated Value: $230,000 - $258,000
3
Beds
3
Baths
1,384
Sq Ft
$176/Sq Ft
Est. Value
About This Home
This home is located at 109 Ronald Tharrington Rd, Louisburg, NC 27549 and is currently estimated at $244,000, approximately $176 per square foot. 109 Ronald Tharrington Rd is a home located in Franklin County with nearby schools including Louisburg Elementary School, Terrell Lane Middle School, and Louisburg High School.
Ownership History
Date
Name
Owned For
Owner Type
Purchase Details
Closed on
Jun 9, 2017
Sold by
Dill Shane Matthew and Dill Katie
Bought by
Smith Gerald Raymond and Smith Sherry Kay
Current Estimated Value
Home Financials for this Owner
Home Financials are based on the most recent Mortgage that was taken out on this home.
Original Mortgage
$87,500
Outstanding Balance
$72,492
Interest Rate
4.05%
Mortgage Type
New Conventional
Estimated Equity
$171,508
Purchase Details
Closed on
Dec 16, 2015
Sold by
Med Properties Llc
Bought by
Harris Katie Amanda and Dill Shane Matthew
Home Financials for this Owner
Home Financials are based on the most recent Mortgage that was taken out on this home.
Original Mortgage
$137,000
Interest Rate
4.25%
Mortgage Type
Adjustable Rate Mortgage/ARM
Purchase Details
Closed on
Aug 1, 2003
Bought by
Med Properties Llc
Create a Home Valuation Report for This Property
The Home Valuation Report is an in-depth analysis detailing your home's value as well as a comparison with similar homes in the area
Home Values in the Area
Average Home Value in this Area
Purchase History
| Date | Buyer | Sale Price | Title Company |
|---|---|---|---|
| Smith Gerald Raymond | $150,000 | Attorney | |
| Harris Katie Amanda | $135,000 | None Available | |
| Med Properties Llc | $157,000 | -- |
Source: Public Records
Mortgage History
| Date | Status | Borrower | Loan Amount |
|---|---|---|---|
| Open | Smith Gerald Raymond | $87,500 | |
| Previous Owner | Harris Katie Amanda | $137,000 |
Source: Public Records
Tax History Compared to Growth
Tax History
| Year | Tax Paid | Tax Assessment Tax Assessment Total Assessment is a certain percentage of the fair market value that is determined by local assessors to be the total taxable value of land and additions on the property. | Land | Improvement |
|---|---|---|---|---|
| 2025 | $1,240 | $187,595 | $37,995 | $149,600 |
| 2024 | $1,240 | $187,595 | $37,995 | $149,600 |
| 2023 | $1,066 | $108,380 | $17,820 | $90,560 |
| 2022 | $1,056 | $108,380 | $17,820 | $90,560 |
| 2021 | $1,067 | $108,380 | $17,820 | $90,560 |
| 2020 | $1,062 | $108,380 | $17,820 | $90,560 |
| 2019 | $1,050 | $108,380 | $17,820 | $90,560 |
| 2018 | $1,047 | $108,380 | $17,820 | $90,560 |
| 2017 | $983 | $92,330 | $14,850 | $77,480 |
| 2016 | $1,015 | $92,330 | $14,850 | $77,480 |
| 2015 | $1,020 | $93,260 | $15,780 | $77,480 |
| 2014 | $946 | $93,260 | $15,780 | $77,480 |
Source: Public Records
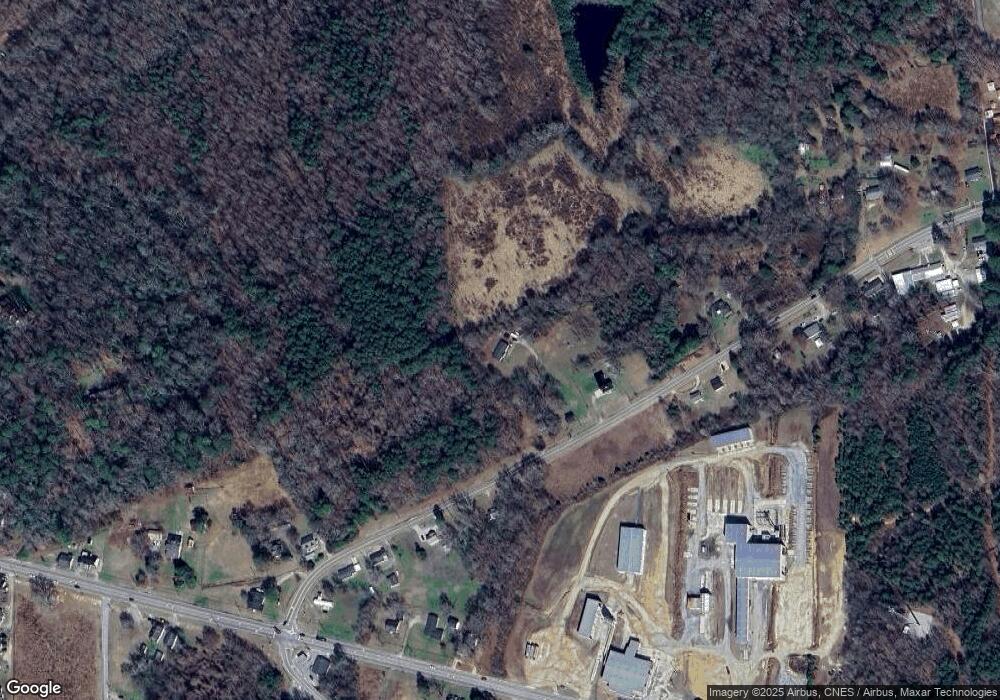
Map
Nearby Homes
- 311 Nc 56 Hwy E
- 191 Nc 56 Hwy E
- 491 Nc 56 Hwy E
- 121 Tanglewood Dr
- 209 Tanglewood Dr
- 102 Tanglewood Dr
- 125 Davis St
- 205 Williamson St
- 7.69 Acres N Carolina 561
- 23.20 Acre N Carolina 561
- 10.26 Acre N Carolina 561
- 4482 N Carolina 39 Hwy
- 604 N Main St
- 0-0 Halifax Rd
- 612 N Main St
- 401 N Main St
- 109 Drew St
- 25 Leisure Ln
- 95 Leisure Ln
- 126 Person St
- 117 Ronald Tharrington Rd
- 78 Ronald Tharrington Rd
- Lot #4 Ronald Tharrington Rd
- 0 Ronald Tharrington Rd Unit 1901659
- LOT A Ronald Tharrington Rd
- LOT B Ronald Tharrington Rd
- 0 Ronald Tharrington Rd Unit 2524807
- Lot 7 Ronald Tharrington Rd
- 0 Ronald Tharrington Rd Unit 2503929
- 0 Ronald Tharrington Rd Unit TR2295426
- 0 Ronald Tharrington Rd Unit Terrell Lane
- 0 Ronald Tharrington Rd Unit Terrell Lane 2423041
- Lot 3 Ronald Tharrington Rd
- 0 Ronald Tharrington Rd Unit 2324391
- 0 Ronald Tharrington Rd Unit 982639
- 0 Ronald Tharrington Rd Unit 1625457
- 0 Ronald Tharrington Rd Unit 1675987
- 0 Ronald Tharrington Rd Unit 1774127
- Lot 3 Ronald Tharrington Rd Unit 3
- 0 Ronald Tharrington Rd Unit 1 1901659