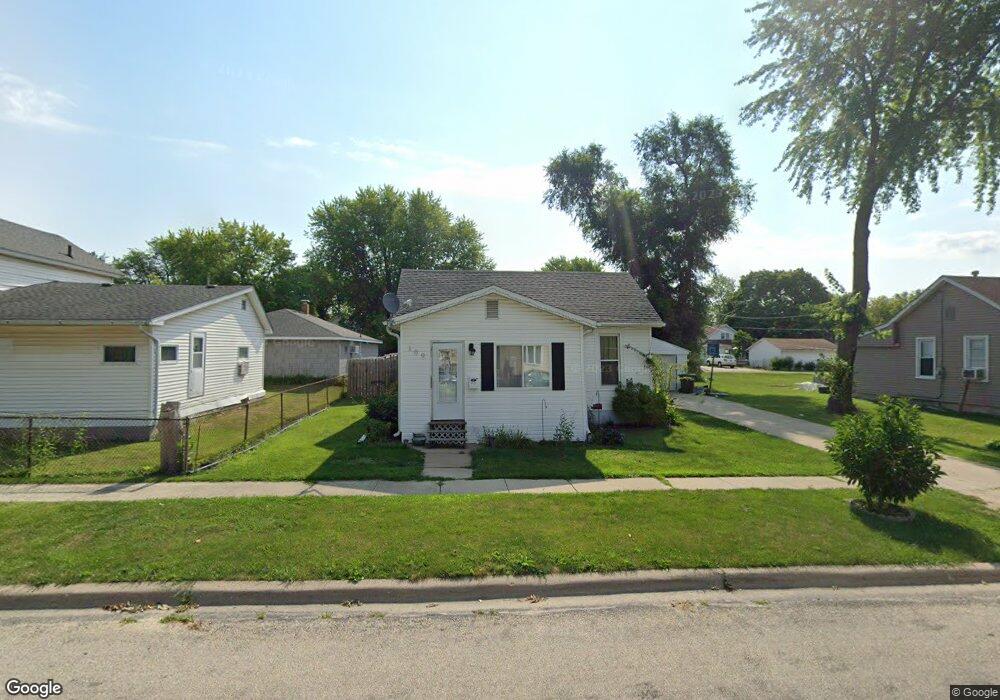
109 S 11th St Rochelle, IL 61068
Estimated Value: $61,000 - $112,209
2
Beds
1
Bath
738
Sq Ft
$123/Sq Ft
Est. Value
About This Home
This home is located at 109 S 11th St, Rochelle, IL 61068 and is currently estimated at $90,802, approximately $123 per square foot. 109 S 11th St is a home located in Ogle County with nearby schools including Rochelle Township High School and St. Paul Lutheran School.
Ownership History
Date
Name
Owned For
Owner Type
Purchase Details
Closed on
Nov 17, 2011
Sold by
Us Bank National Association
Bought by
Phillips David R and Phillips Veronica A
Current Estimated Value
Purchase Details
Closed on
Sep 21, 2011
Sold by
Shockey Alan G
Bought by
Us National Bank Association and The Holders Of The First Franklin Mortga
Purchase Details
Closed on
Jul 27, 2006
Sold by
Moore Robert G and Moore Kimberly A
Bought by
Shockey Alan G
Home Financials for this Owner
Home Financials are based on the most recent Mortgage that was taken out on this home.
Original Mortgage
$92,000
Interest Rate
6.82%
Mortgage Type
New Conventional
Purchase Details
Closed on
Sep 9, 2005
Sold by
Lunardon Brian G
Bought by
Moore Robert G and Moore Kimberly A
Home Financials for this Owner
Home Financials are based on the most recent Mortgage that was taken out on this home.
Original Mortgage
$45,750
Interest Rate
5.89%
Mortgage Type
New Conventional
Create a Home Valuation Report for This Property
The Home Valuation Report is an in-depth analysis detailing your home's value as well as a comparison with similar homes in the area
Home Values in the Area
Average Home Value in this Area
Purchase History
| Date | Buyer | Sale Price | Title Company |
|---|---|---|---|
| Phillips David R | $42,000 | Chicago Title Co | |
| Us National Bank Association | -- | None Available | |
| Shockey Alan G | $90,000 | None Available | |
| Moore Robert G | $58,000 | None Available |
Source: Public Records
Mortgage History
| Date | Status | Borrower | Loan Amount |
|---|---|---|---|
| Previous Owner | Shockey Alan G | $92,000 | |
| Previous Owner | Moore Robert G | $45,750 |
Source: Public Records
Tax History
| Year | Tax Paid | Tax Assessment Tax Assessment Total Assessment is a certain percentage of the fair market value that is determined by local assessors to be the total taxable value of land and additions on the property. | Land | Improvement |
|---|---|---|---|---|
| 2024 | $1,938 | $27,866 | $6,242 | $21,624 |
| 2023 | $1,775 | $26,080 | $5,842 | $20,238 |
| 2022 | $1,753 | $24,817 | $5,559 | $19,258 |
| 2021 | $1,623 | $22,925 | $5,135 | $17,790 |
| 2020 | $1,534 | $21,833 | $4,890 | $16,943 |
| 2019 | $1,495 | $21,458 | $4,806 | $16,652 |
| 2018 | $1,448 | $21,037 | $4,712 | $16,325 |
| 2017 | $1,428 | $21,037 | $4,712 | $16,325 |
| 2016 | $1,400 | $20,460 | $4,583 | $15,877 |
| 2015 | $1,152 | $20,118 | $4,506 | $15,612 |
| 2014 | $1,221 | $18,035 | $4,506 | $13,529 |
| 2013 | $1,306 | $18,907 | $4,724 | $14,183 |
Source: Public Records
Map
Nearby Homes
- 1022 1st Ave
- 901 Garfield Dr
- 500 Woolf Ct
- 821 N 8th St
- 421 7th Ave
- 1010 S 7th St
- 201 Janet Ave
- 1170 Westview Dr
- 1164 Westview Dr
- 1091 S 7th St
- 712 Kelley Dr
- Lt 1 South 7th St
- 1061 Meadow Ln
- Lot 11 Kelley Dr
- 1116 Carrie Ave
- 30 Tilton Manor Dr Unit 205
- 907 Carlisle Dr
- 1133 N 7th St Unit 506
- 909 Carlisle Dr
- 1401 Carrie Ave
Your Personal Tour Guide
Ask me questions while you tour the home.