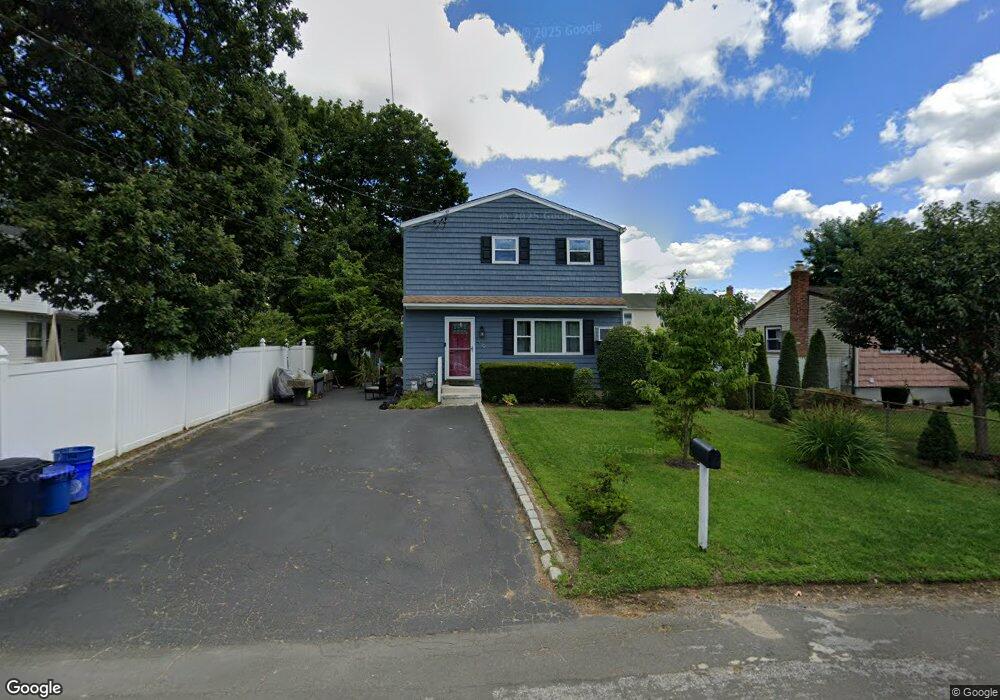
109 S 25th St Wyandanch, NY 11798
Estimated Value: $430,807 - $594,000
--
Bed
--
Bath
1,960
Sq Ft
$269/Sq Ft
Est. Value
About This Home
This home is located at 109 S 25th St, Wyandanch, NY 11798 and is currently estimated at $528,202, approximately $269 per square foot. 109 S 25th St is a home located in Suffolk County with nearby schools including La Francis Hardiman Elementary School, Milton L Olive Middle School, and Wyandanch Memorial High School.
Ownership History
Date
Name
Owned For
Owner Type
Purchase Details
Closed on
Sep 25, 2018
Sold by
Charlie B Reed Lt
Bought by
Reed Charles E and Reed Jessica N
Current Estimated Value
Home Financials for this Owner
Home Financials are based on the most recent Mortgage that was taken out on this home.
Original Mortgage
$212,000
Interest Rate
4.5%
Mortgage Type
New Conventional
Purchase Details
Closed on
Feb 10, 2011
Sold by
Reed Charlie Benjamin and Reed Mary L
Bought by
Reed Charlie B
Create a Home Valuation Report for This Property
The Home Valuation Report is an in-depth analysis detailing your home's value as well as a comparison with similar homes in the area
Home Values in the Area
Average Home Value in this Area
Purchase History
| Date | Buyer | Sale Price | Title Company |
|---|---|---|---|
| Reed Charles E | $250,000 | -- | |
| Reed Charlie B | -- | -- |
Source: Public Records
Mortgage History
| Date | Status | Borrower | Loan Amount |
|---|---|---|---|
| Previous Owner | Reed Charles E | $212,000 |
Source: Public Records
Tax History Compared to Growth
Tax History
| Year | Tax Paid | Tax Assessment Tax Assessment Total Assessment is a certain percentage of the fair market value that is determined by local assessors to be the total taxable value of land and additions on the property. | Land | Improvement |
|---|---|---|---|---|
| 2024 | $10,608 | $2,750 | $150 | $2,600 |
| 2023 | $10,608 | $2,750 | $150 | $2,600 |
| 2022 | $12,272 | $2,750 | $150 | $2,600 |
| 2021 | $12,272 | $2,750 | $150 | $2,600 |
| 2020 | $9,913 | $2,750 | $150 | $2,600 |
| 2019 | $9,913 | $0 | $0 | $0 |
| 2018 | $9,385 | $2,750 | $150 | $2,600 |
| 2017 | $12,593 | $3,700 | $150 | $3,550 |
| 2016 | $12,342 | $3,700 | $150 | $3,550 |
| 2015 | -- | $3,700 | $150 | $3,550 |
| 2014 | -- | $3,700 | $150 | $3,550 |
Source: Public Records
Map
Nearby Homes