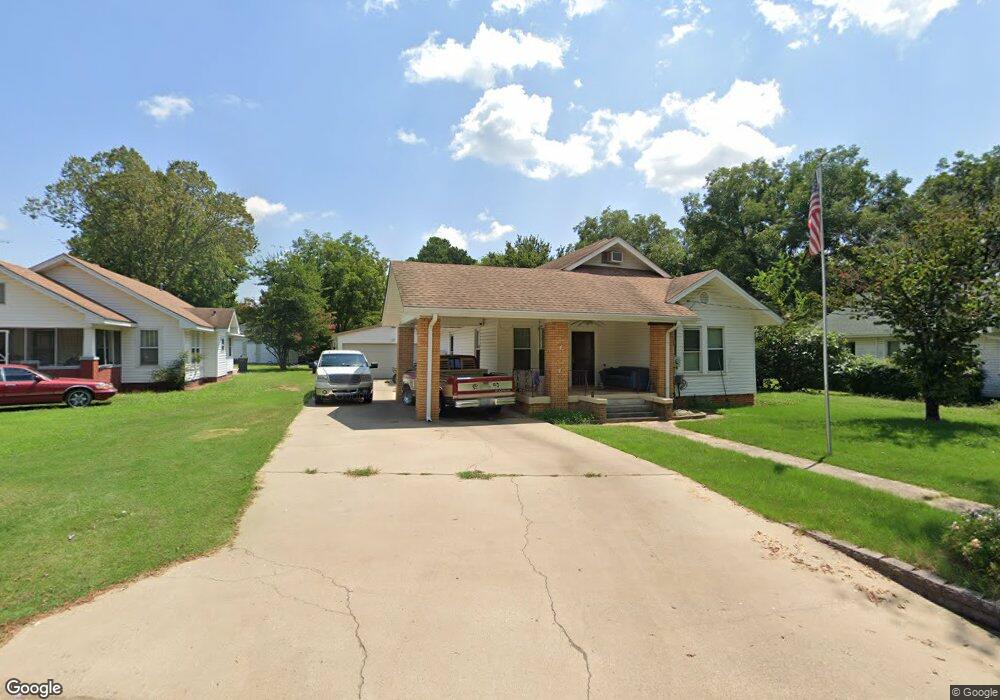
109 S Cherokee St Morrilton, AR 72110
Estimated Value: $113,000 - $140,000
--
Bed
2
Baths
1,723
Sq Ft
$73/Sq Ft
Est. Value
About This Home
This home is located at 109 S Cherokee St, Morrilton, AR 72110 and is currently estimated at $126,327, approximately $73 per square foot. 109 S Cherokee St is a home located in Conway County with nearby schools including Morrilton Primary School, Morrilton Elementary School, and Morrilton Intermediate School.
Ownership History
Date
Name
Owned For
Owner Type
Purchase Details
Closed on
May 20, 2011
Sold by
Williams Roudy D and Williams Jamie
Bought by
Williams Roudy D
Current Estimated Value
Home Financials for this Owner
Home Financials are based on the most recent Mortgage that was taken out on this home.
Original Mortgage
$67,252
Outstanding Balance
$46,715
Interest Rate
4.87%
Estimated Equity
$79,612
Purchase Details
Closed on
Jan 28, 2002
Bought by
Williams Roudy and Sams Helen
Purchase Details
Closed on
Sep 29, 2000
Bought by
Williams Vivian L
Purchase Details
Closed on
May 7, 1999
Bought by
Williams Roudy D
Purchase Details
Closed on
Oct 19, 1998
Bought by
Williams Vivian L
Purchase Details
Closed on
Mar 6, 1998
Bought by
Williams Roudy D
Purchase Details
Closed on
Jun 1, 1985
Bought by
Williams William T
Purchase Details
Closed on
Jan 1, 1984
Bought by
Coleman Coleman E and Coleman M
Create a Home Valuation Report for This Property
The Home Valuation Report is an in-depth analysis detailing your home's value as well as a comparison with similar homes in the area
Home Values in the Area
Average Home Value in this Area
Purchase History
| Date | Buyer | Sale Price | Title Company |
|---|---|---|---|
| Williams Roudy D | -- | -- | |
| Williams Roudy | -- | -- | |
| Williams Vivian L | -- | -- | |
| Williams Roudy D | -- | -- | |
| Williams Vivian L | -- | -- | |
| Williams Roudy D | -- | -- | |
| Williams William T | -- | -- | |
| Coleman Coleman E | -- | -- |
Source: Public Records
Mortgage History
| Date | Status | Borrower | Loan Amount |
|---|---|---|---|
| Open | Coleman Coleman E | $67,252 | |
| Previous Owner | Coleman Coleman E | $30,563 |
Source: Public Records
Tax History Compared to Growth
Tax History
| Year | Tax Paid | Tax Assessment Tax Assessment Total Assessment is a certain percentage of the fair market value that is determined by local assessors to be the total taxable value of land and additions on the property. | Land | Improvement |
|---|---|---|---|---|
| 2024 | $408 | $18,660 | $1,820 | $16,840 |
| 2023 | $444 | $18,660 | $1,820 | $16,840 |
| 2022 | $454 | $18,660 | $1,820 | $16,840 |
| 2021 | $415 | $14,600 | $1,650 | $12,950 |
| 2020 | $415 | $14,600 | $1,650 | $12,950 |
| 2019 | $383 | $14,020 | $1,650 | $12,370 |
| 2018 | $408 | $14,020 | $1,650 | $12,370 |
| 2017 | $408 | $14,020 | $1,650 | $12,370 |
| 2016 | $416 | $14,340 | $1,650 | $12,690 |
| 2015 | $360 | $14,340 | $1,650 | $12,690 |
| 2014 | $360 | $14,340 | $1,650 | $12,690 |
Source: Public Records
Map
Nearby Homes
- 403 W Church St
- 304 S Ola St
- 405 W Valley St
- 116 Lane St
- 116 Lane St Unit 305 S Division Stree
- 202 N Griffin St
- 805 W Elm St
- 403 S West St
- 200 N Morrill St
- Block 1 Lots 13 & 14
- Block 1 Lots 16 & 17
- TBD Burrow
- 111 E Commerce St
- 402 N Morrill St
- 407 N Oak St
- 603 N Division St
- 605 N West St
- 303 S Saint Joseph St
- 505 N Walnut St
- 304 N Saint Joseph St
- 107 S Cherokee St
- 111 S Cherokee St
- 103 S Cherokee St
- 504 W Church St
- 507 Jackson St
- 600 W Church St
- 602 W Church St
- S & 507 Jackson St
- 0 Jackson St
- 500 W Church St
- 505 Jackson St
- 202 S Cherokee St
- 204 S Cherokee St
- 501 Jackson St
- 410 W Church St
- 603 W Church St
- 206 S Cherokee St
- 507 W Church St
- 607 W Church St
- 505 W Church St