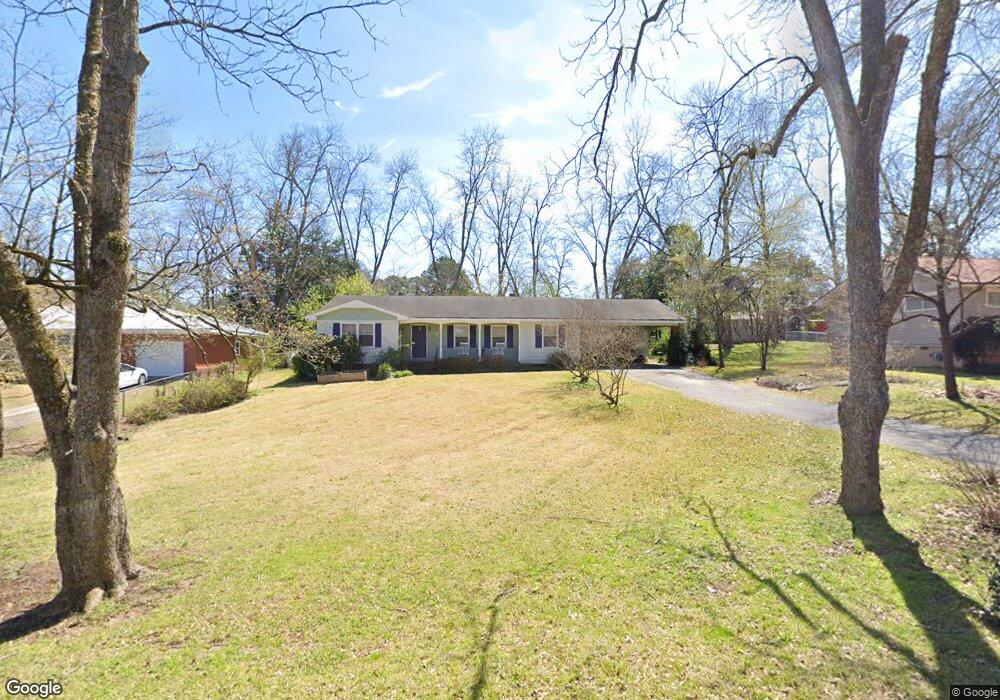
109 S Chilton Crescent Lagrange, GA 30240
Estimated Value: $193,011 - $213,000
3
Beds
2
Baths
1,635
Sq Ft
$124/Sq Ft
Est. Value
About This Home
This home is located at 109 S Chilton Crescent, Lagrange, GA 30240 and is currently estimated at $203,253, approximately $124 per square foot. 109 S Chilton Crescent is a home located in Troup County with nearby schools including Franklin Forest Elementary School, Hollis Hand Elementary School, and Ethel W. Kight Elementary School.
Ownership History
Date
Name
Owned For
Owner Type
Purchase Details
Closed on
Aug 31, 2006
Sold by
Cammon Robert B
Bought by
Hagebak Christen D
Current Estimated Value
Home Financials for this Owner
Home Financials are based on the most recent Mortgage that was taken out on this home.
Original Mortgage
$100,000
Outstanding Balance
$59,759
Interest Rate
6.58%
Mortgage Type
New Conventional
Estimated Equity
$143,494
Purchase Details
Closed on
Jul 10, 1980
Sold by
Kiser C Cleveland Iii & Joy W
Bought by
Cammon Robert B and Cammon Dorothy D
Purchase Details
Closed on
Aug 19, 1977
Sold by
Daniel A E Iii Etal
Bought by
Kiser C Cleveland Iii & Joy W
Purchase Details
Closed on
Jan 1, 1971
Sold by
Grizzell Hubert and Grizzell Elosie
Bought by
Daniel A E Iii Etal
Purchase Details
Closed on
Mar 1, 1968
Sold by
Bryant Wayne and Bryant Judy
Bought by
Grizzell Hubert and Grizzell Elosie
Create a Home Valuation Report for This Property
The Home Valuation Report is an in-depth analysis detailing your home's value as well as a comparison with similar homes in the area
Home Values in the Area
Average Home Value in this Area
Purchase History
| Date | Buyer | Sale Price | Title Company |
|---|---|---|---|
| Hagebak Christen D | $100,000 | -- | |
| Hagebak Christen D | $100,000 | -- | |
| Cammon Robert B | $53,000 | -- | |
| Kiser C Cleveland Iii & Joy W | $43,200 | -- | |
| Daniel A E Iii Etal | -- | -- | |
| Grizzell Hubert | -- | -- |
Source: Public Records
Mortgage History
| Date | Status | Borrower | Loan Amount |
|---|---|---|---|
| Open | Hagebak Christen D | $100,000 | |
| Closed | Hagebak Christen D | $100,000 |
Source: Public Records
Tax History Compared to Growth
Tax History
| Year | Tax Paid | Tax Assessment Tax Assessment Total Assessment is a certain percentage of the fair market value that is determined by local assessors to be the total taxable value of land and additions on the property. | Land | Improvement |
|---|---|---|---|---|
| 2024 | $1,553 | $58,920 | $6,720 | $52,200 |
| 2023 | $1,313 | $50,120 | $6,720 | $43,400 |
| 2022 | $1,260 | $47,120 | $6,720 | $40,400 |
| 2021 | $869 | $30,800 | $6,720 | $24,080 |
| 2020 | $869 | $30,800 | $6,720 | $24,080 |
| 2019 | $803 | $28,600 | $6,720 | $21,880 |
| 2018 | $790 | $28,180 | $6,300 | $21,880 |
| 2017 | $790 | $28,180 | $6,300 | $21,880 |
| 2016 | $768 | $27,457 | $6,300 | $21,157 |
| 2015 | $784 | $27,910 | $6,754 | $21,157 |
| 2014 | $751 | $26,797 | $6,754 | $20,043 |
| 2013 | -- | $28,305 | $6,740 | $21,565 |
Source: Public Records
Map
Nearby Homes
- 106 S Chilton Crescent
- 201 S Chilton Crescent
- 203 S Chilton Crescent
- 724 Camellia Dr
- 106 Ewing St
- 102 Ewing St
- 100 Creekside Dr Unit LOT 60A
- 107 Dixie Creek Dr
- 145 Turner St
- 748 Lakewood Dr
- 204 Colonial St
- 110 Russell St
- 900 North St
- 806 New Franklin Rd
- 114 Briarcliff Rd
- 109 Thomas St
- 219 Banks St
- 134 S Page St
- 109 Dogwood Dr
- 400 S Page St
- 107 S Chilton Crescent
- 113 S Chilton Crescent
- 934 Malibu Dr
- 121 S Chilton Crescent
- 932 Malibu Dr
- 117 S Chilton Crescent
- 110 S Chilton Crescent
- 112 S Chilton Crescent
- 108 S Chilton Crescent
- 930 Malibu Dr
- 1045 Mooty Bridge Rd
- 936 Malibu Dr
- 119 S Chilton Crescent
- 1043 Mooty Bridge Rd
- 1145 Mooty Bridge Rd
- 116 S Chilton Crescent
- 928 Malibu Dr
- 1147 Mooty Bridge Rd
- 943 Malibu Dr
- 945 Malibu Dr