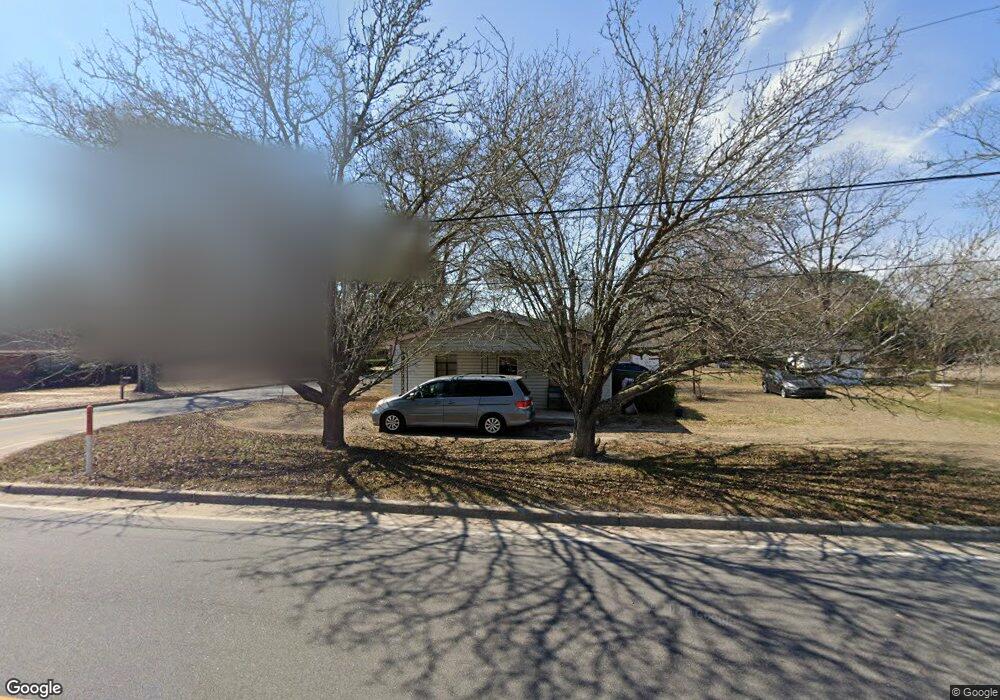
109 S Claxton Ave Claxton, GA 30417
Estimated Value: $66,000 - $94,000
2
Beds
1
Bath
924
Sq Ft
$85/Sq Ft
Est. Value
About This Home
This home is located at 109 S Claxton Ave, Claxton, GA 30417 and is currently estimated at $78,569, approximately $85 per square foot. 109 S Claxton Ave is a home located in Evans County with nearby schools including Claxton Elementary School, Second Chance, and Claxton Middle School.
Ownership History
Date
Name
Owned For
Owner Type
Purchase Details
Closed on
Feb 11, 2025
Sold by
Lumayno Smith Emely S
Bought by
Ellis Janet D and Rebollido John Briegi
Current Estimated Value
Home Financials for this Owner
Home Financials are based on the most recent Mortgage that was taken out on this home.
Original Mortgage
$63,000
Outstanding Balance
$55,821
Interest Rate
7.04%
Mortgage Type
New Conventional
Estimated Equity
$22,748
Purchase Details
Closed on
Apr 5, 2021
Sold by
Deloach Cynthia M
Bought by
Smith Emely S Lumayo
Home Financials for this Owner
Home Financials are based on the most recent Mortgage that was taken out on this home.
Original Mortgage
$35,700
Interest Rate
3%
Mortgage Type
New Conventional
Purchase Details
Closed on
Dec 9, 2020
Sold by
Morris Linda T
Bought by
Deloach Cynthia M and Morris David P
Purchase Details
Closed on
Feb 7, 1997
Sold by
Cannon Harry
Bought by
Morris Linda T
Purchase Details
Closed on
Sep 18, 1996
Sold by
Dukes Marcus D
Bought by
Cannon Harry
Create a Home Valuation Report for This Property
The Home Valuation Report is an in-depth analysis detailing your home's value as well as a comparison with similar homes in the area
Home Values in the Area
Average Home Value in this Area
Purchase History
| Date | Buyer | Sale Price | Title Company |
|---|---|---|---|
| Ellis Janet D | $70,000 | -- | |
| Smith Emely S Lumayo | $42,000 | -- | |
| Deloach Cynthia M | -- | -- | |
| Morris Linda T | $34,000 | -- | |
| Cannon Harry | $30,000 | -- |
Source: Public Records
Mortgage History
| Date | Status | Borrower | Loan Amount |
|---|---|---|---|
| Open | Ellis Janet D | $63,000 | |
| Closed | Ellis Janet D | $63,000 | |
| Previous Owner | Smith Emely S Lumayo | $35,700 |
Source: Public Records
Tax History Compared to Growth
Tax History
| Year | Tax Paid | Tax Assessment Tax Assessment Total Assessment is a certain percentage of the fair market value that is determined by local assessors to be the total taxable value of land and additions on the property. | Land | Improvement |
|---|---|---|---|---|
| 2024 | $713 | $27,576 | $3,080 | $24,496 |
| 2023 | $694 | $15,160 | $1,640 | $13,520 |
| 2022 | $549 | $15,160 | $1,640 | $13,520 |
| 2021 | $534 | $15,160 | $1,640 | $13,520 |
| 2020 | $536 | $15,160 | $1,640 | $13,520 |
| 2019 | $494 | $15,160 | $1,640 | $13,520 |
| 2018 | $495 | $15,160 | $1,640 | $13,520 |
| 2017 | $483 | $15,160 | $1,640 | $13,520 |
| 2016 | $488 | $15,200 | $1,640 | $13,560 |
| 2015 | -- | $16,960 | $1,640 | $15,320 |
| 2014 | -- | $16,960 | $1,640 | $15,320 |
| 2013 | -- | $17,200 | $1,640 | $15,560 |
Source: Public Records
Map
Nearby Homes
- 107 E Liberty St
- 12 S Duval St
- 0 Ga Hwy 129 N Unit 10564606
- 201 New Dr
- 107 Marguerite St
- 326 N River St
- 3 S Spring St
- 6 N Spring St
- 320 N Duval St
- 511 W Smith St
- 3 Honeysuckle Dr
- 7 Honeysuckle Dr
- 9 Honeysuckle Dr
- 606 Park Ave
- 7 Honeysuckle Way
- 610 W Liberty St
- 10 Honeysuckle Dr
- 12 Wisteria Ln
- 12 Wysteria Ln
- 712 Rosedale Ave
- S S Claxton Ave
- 107 S Claxton Ave
- 107 S Claxton Ave
- 406 E Smith St
- 405 E Smith St
- 403 E Smith St
- 105 S Claxton Ave
- 108 S River St
- 401 E Smith St
- 202 S Claxton Ave
- 106 S River St
- 102 S River St
- 19 S Claxton Ave
- 204 S River St
- E E Smith St
- 24 S River St
- 404 Ridge St
- 302 S Claxton Ave
- 22 S River St
- 201 S River St