Estimated Value: $249,000 - $524,000
4
Beds
3
Baths
4,040
Sq Ft
$96/Sq Ft
Est. Value
About This Home
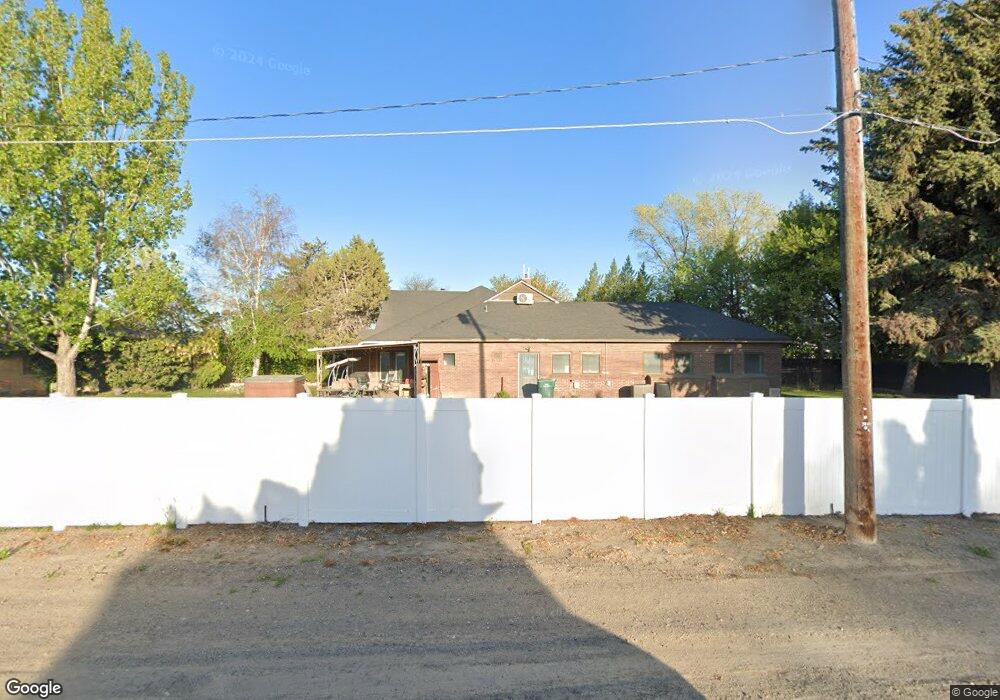
This home is located at 109 S Main St, Paul, ID 83347 and is currently estimated at $389,259, approximately $96 per square foot. 109 S Main St is a home located in Minidoka County with nearby schools including Paul Elementary School, Minico Senior High School, and Artec Charter School.
Ownership History
Date
Name
Owned For
Owner Type
Purchase Details
Closed on
Jul 25, 2017
Sold by
Sworn Benjamin Carson
Bought by
Page William and Page Melanie
Current Estimated Value
Home Financials for this Owner
Home Financials are based on the most recent Mortgage that was taken out on this home.
Original Mortgage
$146,470
Outstanding Balance
$119,238
Interest Rate
3.09%
Mortgage Type
Adjustable Rate Mortgage/ARM
Estimated Equity
$270,021
Purchase Details
Closed on
Feb 15, 2017
Sold by
Wells Fargo Bank N A
Bought by
The Secretary Of Hud
Purchase Details
Closed on
Feb 29, 2012
Sold by
Brown Kari Klosterman and Brown Kari K
Bought by
Brown Mark
Home Financials for this Owner
Home Financials are based on the most recent Mortgage that was taken out on this home.
Original Mortgage
$194,930
Interest Rate
3.83%
Mortgage Type
FHA
Purchase Details
Closed on
Jul 10, 2006
Sold by
Brown Mark D
Bought by
Brown Kari Klosterman
Create a Home Valuation Report for This Property
The Home Valuation Report is an in-depth analysis detailing your home's value as well as a comparison with similar homes in the area
Home Values in the Area
Average Home Value in this Area
Purchase History
| Date | Buyer | Sale Price | Title Company |
|---|---|---|---|
| Page William | -- | First American Title Burley | |
| The Secretary Of Hud | -- | First American Title Burley | |
| Wells Fargo Bank Na | $139,500 | First American Title Burley | |
| Brown Mark | -- | Rupert Land Title | |
| Brown Mark | -- | Rupert Land Title | |
| Brown Kari Klosterman | -- | -- |
Source: Public Records
Mortgage History
| Date | Status | Borrower | Loan Amount |
|---|---|---|---|
| Open | Page William | $146,470 | |
| Previous Owner | Brown Mark | $194,930 |
Source: Public Records
Tax History Compared to Growth
Tax History
| Year | Tax Paid | Tax Assessment Tax Assessment Total Assessment is a certain percentage of the fair market value that is determined by local assessors to be the total taxable value of land and additions on the property. | Land | Improvement |
|---|---|---|---|---|
| 2024 | $2,910 | $475,540 | $32,799 | $442,741 |
| 2023 | $2,347 | $461,079 | $32,799 | $428,280 |
| 2022 | $3,231 | $435,085 | $28,459 | $406,626 |
| 2021 | $2,713 | $335,920 | $22,431 | $313,489 |
| 2020 | $2,335 | $271,668 | $17,245 | $254,423 |
| 2019 | $2,337 | $257,940 | $0 | $0 |
| 2018 | $1,830 | $216,741 | $17,245 | $199,496 |
| 2017 | $3,429 | $233,518 | $13,689 | $219,829 |
| 2016 | $1,649 | $94,745 | $0 | $0 |
| 2015 | $1,801 | $0 | $0 | $0 |
| 2014 | $1,801 | $0 | $0 | $0 |
| 2012 | -- | $0 | $0 | $0 |
Source: Public Records
Map
Nearby Homes