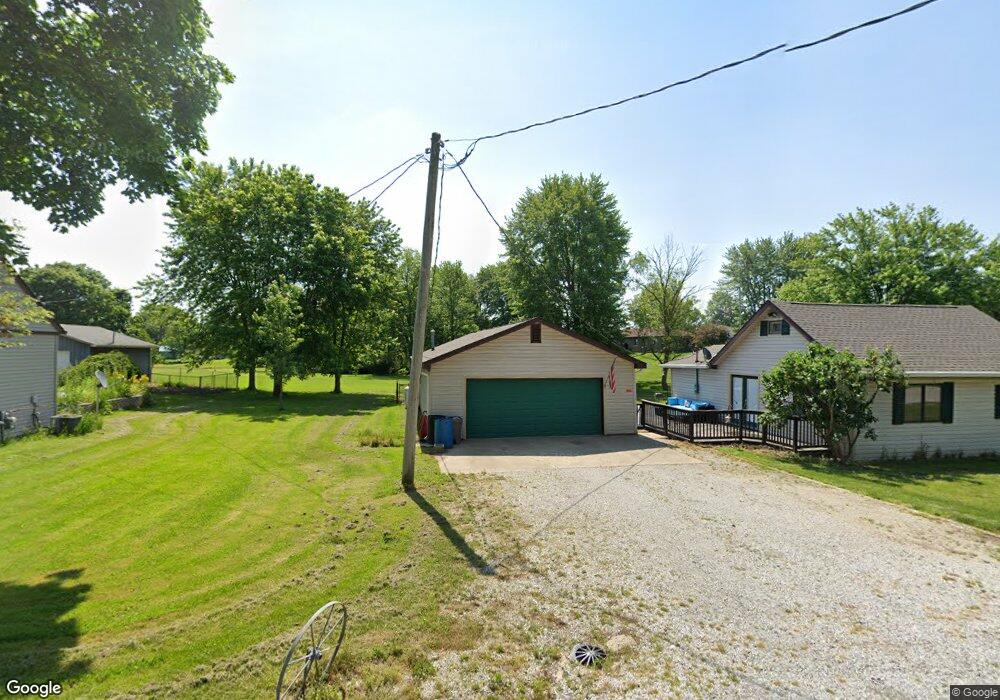
109 S Walnut St Jamestown, IN 46147
Estimated Value: $159,000 - $176,000
2
Beds
1
Bath
940
Sq Ft
$181/Sq Ft
Est. Value
About This Home
This home is located at 109 S Walnut St, Jamestown, IN 46147 and is currently estimated at $169,891, approximately $180 per square foot. 109 S Walnut St is a home located in Boone County with nearby schools including Western Boone Junior/Senior High School.
Ownership History
Date
Name
Owned For
Owner Type
Purchase Details
Closed on
Jul 18, 2013
Sold by
Rode Paul W
Bought by
Heagy Douglas J and Heagy Angela
Current Estimated Value
Home Financials for this Owner
Home Financials are based on the most recent Mortgage that was taken out on this home.
Original Mortgage
$78,551
Outstanding Balance
$58,189
Interest Rate
4.37%
Mortgage Type
FHA
Estimated Equity
$111,702
Purchase Details
Closed on
Oct 29, 2010
Sold by
Mitchell Sean T and Mitchell Cheryl A
Bought by
Rode Paul W
Home Financials for this Owner
Home Financials are based on the most recent Mortgage that was taken out on this home.
Original Mortgage
$60,000
Interest Rate
4.36%
Mortgage Type
New Conventional
Purchase Details
Closed on
Jan 30, 2008
Sold by
Braner Todd D and Braner Jill
Bought by
Mitchell Sean T and Mitchell Cheryl A
Home Financials for this Owner
Home Financials are based on the most recent Mortgage that was taken out on this home.
Original Mortgage
$80,000
Interest Rate
5.75%
Mortgage Type
New Conventional
Create a Home Valuation Report for This Property
The Home Valuation Report is an in-depth analysis detailing your home's value as well as a comparison with similar homes in the area
Home Values in the Area
Average Home Value in this Area
Purchase History
| Date | Buyer | Sale Price | Title Company |
|---|---|---|---|
| Heagy Douglas J | -- | None Available | |
| Rode Paul W | -- | -- | |
| Mitchell Sean T | -- | -- |
Source: Public Records
Mortgage History
| Date | Status | Borrower | Loan Amount |
|---|---|---|---|
| Open | Heagy Douglas J | $78,551 | |
| Previous Owner | Rode Paul W | $60,000 | |
| Previous Owner | Mitchell Sean T | $80,000 |
Source: Public Records
Tax History Compared to Growth
Tax History
| Year | Tax Paid | Tax Assessment Tax Assessment Total Assessment is a certain percentage of the fair market value that is determined by local assessors to be the total taxable value of land and additions on the property. | Land | Improvement |
|---|---|---|---|---|
| 2024 | $790 | $129,700 | $21,300 | $108,400 |
| 2023 | $707 | $119,600 | $21,300 | $98,300 |
| 2022 | $663 | $111,300 | $21,300 | $90,000 |
| 2021 | $541 | $95,800 | $21,300 | $74,500 |
| 2020 | $480 | $90,100 | $21,300 | $68,800 |
| 2019 | $460 | $88,900 | $21,300 | $67,600 |
| 2018 | $401 | $95,500 | $21,300 | $74,200 |
| 2017 | $434 | $92,800 | $21,300 | $71,500 |
| 2016 | $444 | $89,700 | $21,300 | $68,400 |
| 2014 | $346 | $90,400 | $21,300 | $69,100 |
| 2013 | $416 | $77,700 | $16,200 | $61,500 |
Source: Public Records
Map
Nearby Homes
- 137 E Vine St
- 241 S Walnut St
- 230 S High St
- 421 Lowry St
- 34 W Oak St
- 230 W Elm St
- 409 W Elm St
- SR 234 W Indiana 234
- 7099 S 1100 W
- 8112 W County Road 1000 N
- 9136 W 500 S
- 4847 S State Road 75
- 10000 N Block Co Road 1250 Rd W
- 6440 Ladoga Rd
- 7702 N County Road 300 W
- 3468 S 900 W
- 00 State Road 75
- 0 Indiana 236
- 6125 Indiana 236
- 0 N State Road 75 Unit MBR22060685
- 105 S Walnut St
- 139 E Jefferson St
- 39 S Walnut St
- 210 Hillview Dr
- 121 S Lebanon St
- 202 Hillview Dr
- 42 S Walnut St
- 33 S Walnut St
- 134 E Vine St
- 134 E Jefferson St
- 125 S Lebanon St
- 109 S Lebanon St
- 34 S Walnut St
- 105 S Lebanon St
- 220 Hillview Dr
- 137 S Lebanon St
- 41 S Lebanon St
- 205 E Main St
- 229 E Main St
- 141 E Main St