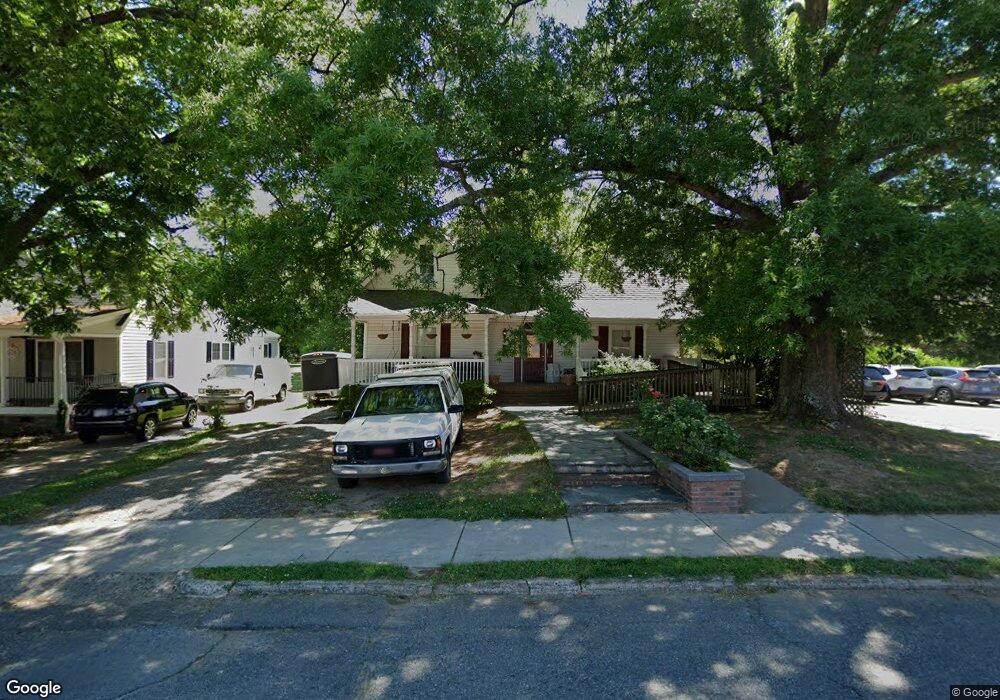
109 S Watterson St Kings Mountain, NC 28086
Estimated Value: $150,603 - $236,000
--
Bed
--
Bath
1,445
Sq Ft
$142/Sq Ft
Est. Value
About This Home
This home is located at 109 S Watterson St, Kings Mountain, NC 28086 and is currently estimated at $205,401, approximately $142 per square foot. 109 S Watterson St is a home located in Cleveland County with nearby schools including West Elementary School, Kings Mountain Middle, and Kings Mountain Intermediate School.
Ownership History
Date
Name
Owned For
Owner Type
Purchase Details
Closed on
Oct 26, 2021
Sold by
Workman Donald Ray and Workman Wanda S
Bought by
Workman Donald Ray and Workman Wanda S
Current Estimated Value
Home Financials for this Owner
Home Financials are based on the most recent Mortgage that was taken out on this home.
Original Mortgage
$38,800
Outstanding Balance
$35,529
Interest Rate
3.09%
Estimated Equity
$169,872
Purchase Details
Closed on
Mar 28, 2013
Sold by
Herndon Mary B and Summitt Kathleen B
Bought by
Workman Donald Ray and Workman Wanda S
Home Financials for this Owner
Home Financials are based on the most recent Mortgage that was taken out on this home.
Original Mortgage
$45,000
Interest Rate
3.55%
Mortgage Type
Future Advance Clause Open End Mortgage
Create a Home Valuation Report for This Property
The Home Valuation Report is an in-depth analysis detailing your home's value as well as a comparison with similar homes in the area
Home Values in the Area
Average Home Value in this Area
Purchase History
| Date | Buyer | Sale Price | Title Company |
|---|---|---|---|
| Workman Donald Ray | -- | None Available | |
| Workman Donald Ray | -- | None Available |
Source: Public Records
Mortgage History
| Date | Status | Borrower | Loan Amount |
|---|---|---|---|
| Open | Workman Donald Ray | $38,800 | |
| Closed | Workman Donald Ray | $45,000 |
Source: Public Records
Tax History Compared to Growth
Tax History
| Year | Tax Paid | Tax Assessment Tax Assessment Total Assessment is a certain percentage of the fair market value that is determined by local assessors to be the total taxable value of land and additions on the property. | Land | Improvement |
|---|---|---|---|---|
| 2025 | $1,434 | $139,897 | $27,000 | $112,897 |
| 2024 | $762 | $63,094 | $14,400 | $48,694 |
| 2023 | $758 | $63,094 | $14,400 | $48,694 |
| 2022 | $726 | $63,094 | $14,400 | $48,694 |
| 2021 | $730 | $63,094 | $14,400 | $48,694 |
| 2020 | $489 | $40,561 | $11,100 | $29,461 |
| 2019 | $489 | $40,561 | $11,100 | $29,461 |
| 2018 | $487 | $40,561 | $11,100 | $29,461 |
| 2017 | $485 | $40,561 | $11,100 | $29,461 |
| 2016 | $485 | $40,561 | $11,100 | $29,461 |
| 2015 | $583 | $50,428 | $11,100 | $39,328 |
| 2014 | $573 | $49,535 | $11,100 | $38,435 |
Source: Public Records
Map
Nearby Homes
- 106 N Tracy St
- 300 N Watterson St
- 400 S Cansler St
- 316 S Cansler St
- 310 Campbell Cir
- 811 W Gold St Unit 26
- 411 S Battleground Ave
- 200 E Gold St
- 207 Morris St
- 110 N Gaston St
- 5066 Beargrass Dr
- 312 Fulton St
- 116 Walker St
- 300 Fulton St
- 405 Clinton Dr
- 522 Waco Rd
- 311 E King St Unit 2
- 308 N Carpenter St
- 524 Waco Rd
- 442 Phifer Rd
- 107 S Watterson St
- 408 W Mountain St
- 105 S Watterson St
- 406 W Mountain St
- 101 S Watterson St
- 404 W Mountain St
- 404 W Mountain St
- 411 W Mountain St
- 411 W Mountain St Unit 1
- 501 W Mountain St
- 407 W Mountain St
- 102 S Watterson St
- 402 W Mountain St
- 405 W Mountain St
- 21 N Watterson St Unit 21
- 503 W Mountain St
- 403 W Mountain St
- 400 W Mountain St
- 200 S Watterson St
- 102 S Tracy St