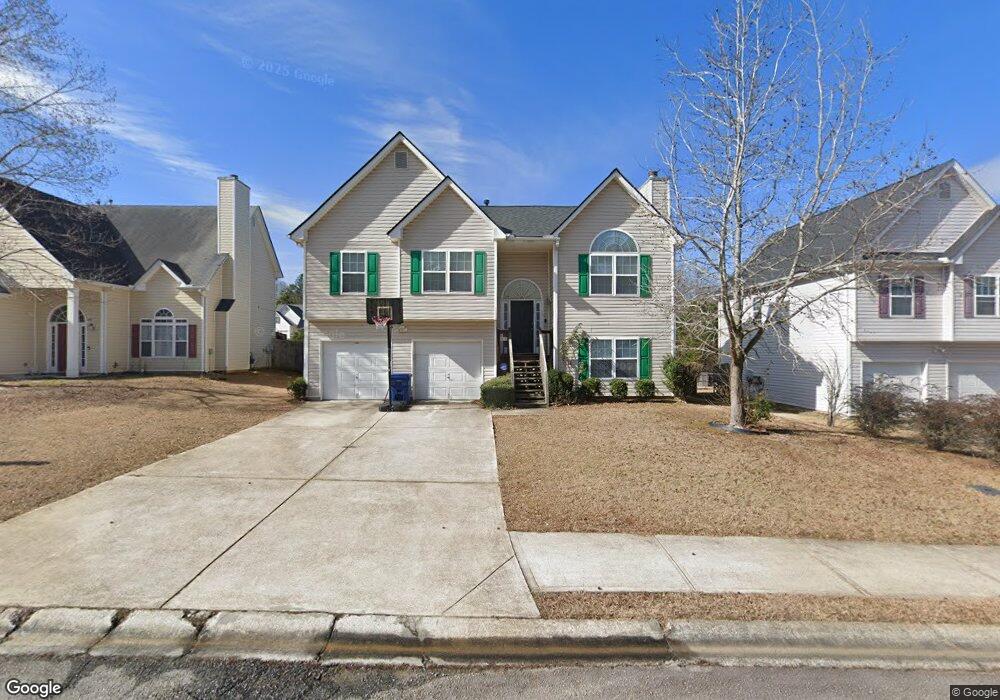
109 Saint Ann Cir Dallas, GA 30157
Estimated Value: $298,341 - $330,000
3
Beds
2
Baths
1,467
Sq Ft
$211/Sq Ft
Est. Value
About This Home
This home is located at 109 Saint Ann Cir, Dallas, GA 30157 and is currently estimated at $309,085, approximately $210 per square foot. 109 Saint Ann Cir is a home located in Paulding County with nearby schools including Allgood Elementary School, Herschel Jones Middle School, and Paulding County High School.
Ownership History
Date
Name
Owned For
Owner Type
Purchase Details
Closed on
Mar 28, 2008
Sold by
Ortiz Toby and Ortiz Melanie M
Bought by
Johnson Billy D Latrica M
Current Estimated Value
Home Financials for this Owner
Home Financials are based on the most recent Mortgage that was taken out on this home.
Original Mortgage
$154,427
Outstanding Balance
$97,823
Interest Rate
5.97%
Mortgage Type
New Conventional
Estimated Equity
$211,262
Purchase Details
Closed on
May 3, 2005
Sold by
Henderson Enterprises Inc
Bought by
Ortiz Toby
Home Financials for this Owner
Home Financials are based on the most recent Mortgage that was taken out on this home.
Original Mortgage
$26,980
Interest Rate
5.99%
Mortgage Type
New Conventional
Purchase Details
Closed on
Oct 12, 2004
Sold by
Tanglewood Homes Inc
Bought by
Henderson Enterprises Inc
Home Financials for this Owner
Home Financials are based on the most recent Mortgage that was taken out on this home.
Original Mortgage
$95,000
Interest Rate
5.62%
Create a Home Valuation Report for This Property
The Home Valuation Report is an in-depth analysis detailing your home's value as well as a comparison with similar homes in the area
Home Values in the Area
Average Home Value in this Area
Purchase History
| Date | Buyer | Sale Price | Title Company |
|---|---|---|---|
| Johnson Billy D Latrica M | $155,700 | -- | |
| Ortiz Toby | $134,900 | -- | |
| Henderson Enterprises Inc | $30,000 | -- |
Source: Public Records
Mortgage History
| Date | Status | Borrower | Loan Amount |
|---|---|---|---|
| Open | Johnson Billy D Latrica M | $154,427 | |
| Previous Owner | Ortiz Toby | $26,980 | |
| Previous Owner | Ortiz Toby | $107,920 | |
| Previous Owner | Henderson Enterprises Inc | $95,000 |
Source: Public Records
Tax History Compared to Growth
Tax History
| Year | Tax Paid | Tax Assessment Tax Assessment Total Assessment is a certain percentage of the fair market value that is determined by local assessors to be the total taxable value of land and additions on the property. | Land | Improvement |
|---|---|---|---|---|
| 2024 | $3,787 | $123,924 | $12,000 | $111,924 |
| 2023 | $3,808 | $128,116 | $12,000 | $116,116 |
| 2022 | $2,888 | $112,672 | $12,000 | $100,672 |
| 2021 | $2,398 | $84,380 | $8,000 | $76,380 |
| 2020 | $2,475 | $74,696 | $8,000 | $66,696 |
| 2019 | $2,227 | $66,568 | $8,000 | $58,568 |
| 2018 | $1,800 | $61,612 | $8,000 | $53,612 |
| 2017 | $1,963 | $58,188 | $8,000 | $50,188 |
| 2016 | $1,798 | $53,904 | $8,000 | $45,904 |
| 2015 | $1,180 | $40,188 | $8,000 | $32,188 |
| 2014 | $1,080 | $36,068 | $8,000 | $28,068 |
| 2013 | -- | $23,320 | $8,000 | $15,320 |
Source: Public Records
Map
Nearby Homes
- 212 Remington Place Blvd
- 305 Remington Place Blvd
- Darwin Plan at Oakleigh Glen
- Penwell Plan at Oakleigh Glen
- Robie Plan at Oakleigh Glen
- at Oakleigh Glen
- Aria Plan at Oakleigh Glen
- Belhaven Plan at Oakleigh Glen
- 120 Remington Place Blvd
- 102 Natalie Ct
- 412 Oak View Ln
- 0 Jimmy Campbell Pkwy Unit 7607737
- 0 Jimmy Campbell Pkwy Unit 10556704
- 500 Oak View Ln
- 201 Oak View Ln
- 508 Oak View Ln
- 414 Oak View Ln
- 510 Oak View Ln
- 512 Oak View Ln
- 109 St Ann Cir
- 107 St Ann Cir
- 107 Saint Ann Cir Unit 107
- 111 St Ann Cir
- 105 St Ann Cir
- 133 St Ann Cir Unit 257
- 133 St Ann Cir
- 133 St Ann Cir
- 135 St Ann Cir
- 115 St Ann Cir
- 106 St Ann Cir
- 115 Saint Ann Cir
- 131 St Ann Cir
- 108 St Ann Cir
- 104 St Ann Cir
- 103 St Ann Cir
- 125 St Ann Cir
- 102 St Ann Cir
- 110 St Ann Cir Unit 243
- 110 St Ann Cir