
Landlord's Agent in 2023
Jing Wang
Wang J Realty LLC
(630) 299-6684
9 in this area
76 Total Sales


Estimated Value: $278,000 - $304,000
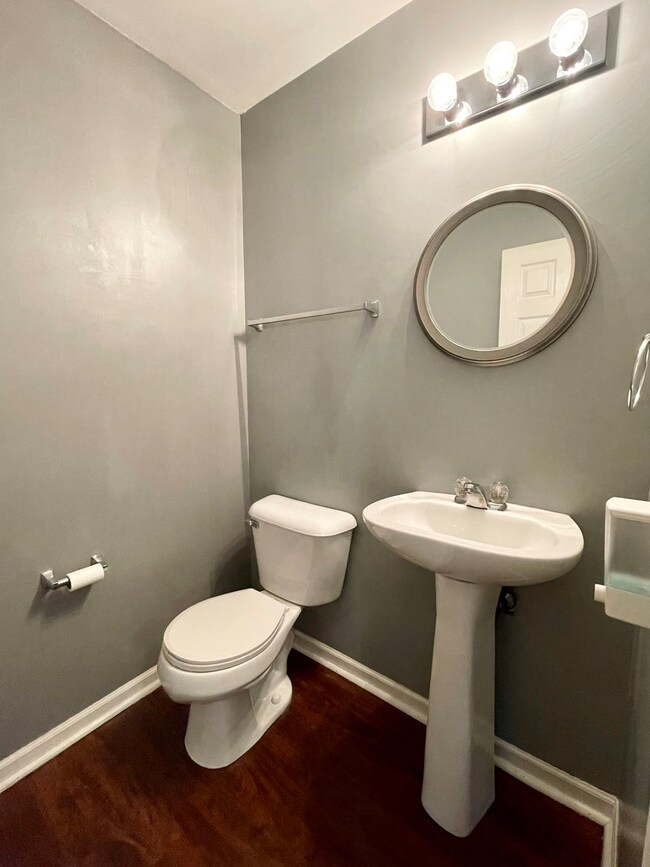
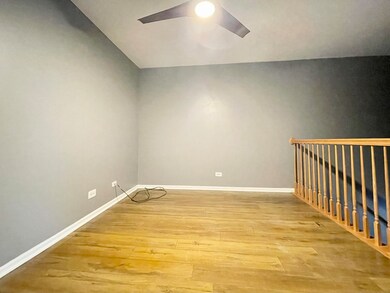
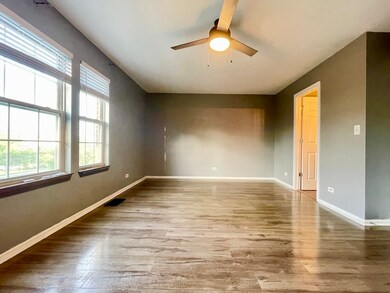
BEAUTIFUL UNIT 2 STORY TOWNHOME W/ 3 BEDROOM AND 2.5 BATHROOMS PLUS LOFT FOR EXTRA SPACE.LAMINATE FLOORING THROUGHOUT. MASTER BEDROOM FEATURING WALK-IN CLOSET. 2ND FLOOR LAUNDRY ROOM. KITCHEN BREAKFAST BAR, 42" CABINETS, LARGE COUNTER SPACE. TWO-CAR GARAGE. CONVENIENT LOCATION FOR ALL EVERYDAY NEEDS. DISHWASHER WILL BE REPLACED BEFORE TENANTS MOVE-IN. UNIT WILL BE PROFESSIONALLY CLEANED. CREDIT SCORE MUST BE AT LEAST 680 AND INCOME NEEDS TO BE 3 TIMES OF THE RENT. NON-REFUNDABLE PET DEPOSIT $350/PET.
Last Agent to Rent the Property
Wang J Realty LLC License #471019961 Listed on: 06/01/2023
| Date | Buyer | Sale Price | Title Company |
|---|---|---|---|
| Xiong Ming | $270,000 | Citywide Title | |
| Butera Grazia | $182,500 | Chicago Title Insurance Co |
| Date | Status | Borrower | Loan Amount |
|---|---|---|---|
| Open | Xiong Ming | $183,750 | |
| Previous Owner | Butera Grazia | $178,381 |
| Date | Event | Price | List to Sale | Price per Sq Ft | Prior Sale |
|---|---|---|---|---|---|
| 07/03/2023 07/03/23 | Rented | $2,400 | -99.1% | -- | |
| 06/12/2023 06/12/23 | Under Contract | -- | -- | -- | |
| 06/01/2023 06/01/23 | Sold | $270,000 | 0.0% | $161 / Sq Ft | View Prior Sale |
| 06/01/2023 06/01/23 | For Rent | $2,400 | 0.0% | -- | |
| 04/24/2023 04/24/23 | Pending | -- | -- | -- | |
| 04/21/2023 04/21/23 | For Sale | $249,900 | 0.0% | $149 / Sq Ft | |
| 05/21/2022 05/21/22 | Rented | $2,395 | 0.0% | -- | |
| 05/21/2022 05/21/22 | For Rent | $2,395 | 0.0% | -- | |
| 05/16/2022 05/16/22 | Off Market | $2,395 | -- | -- | |
| 04/01/2022 04/01/22 | For Rent | $2,395 | -- | -- |
| Year | Tax Paid | Tax Assessment Tax Assessment Total Assessment is a certain percentage of the fair market value that is determined by local assessors to be the total taxable value of land and additions on the property. | Land | Improvement |
|---|---|---|---|---|
| 2024 | $6,247 | $77,630 | $12,992 | $64,638 |
| 2023 | $0 | $67,504 | $11,297 | $56,207 |
| 2022 | $5,155 | $63,088 | $10,558 | $52,530 |
| 2021 | $4,955 | $58,960 | $9,867 | $49,093 |
| 2020 | $4,842 | $57,243 | $9,580 | $47,663 |
| 2019 | $4,851 | $56,539 | $9,580 | $46,959 |
| 2018 | $4,077 | $48,184 | $8,164 | $40,020 |
| 2017 | $3,937 | $44,409 | $7,524 | $36,885 |
| 2016 | $3,575 | $40,372 | $6,840 | $33,532 |
| 2015 | $3,278 | $36,046 | $6,107 | $29,939 |
| 2014 | -- | $34,005 | $5,761 | $28,244 |
| 2013 | -- | $36,962 | $6,262 | $30,700 |
Landlord's Agent in 2023
Jing Wang
Wang J Realty LLC
(630) 299-6684
9 in this area
76 Total Sales
Seller's Agent in 2023
David Lobraco
Fulton Grace Realty
(630) 802-9222
1 in this area
45 Total Sales
Tenant's Agent in 2023
Victoria Tan
Compass
(630) 618-6225
8 in this area
329 Total Sales
Seller's Agent in 2022
Monica Domian
The McDonald Group
(630) 673-7263
31 Total Sales
Buyer's Agent in 2022
Jeffrey Ibsen
@ Properties
(331) 444-2445
26 Total Sales
Source: Midwest Real Estate Data (MRED)
MLS Number: 11797575
APN: 03-03-458-049
Disclaimer: Certain information contained herein is derived from information provided by parties other than Homes.com. All information provided is deemed reliable, but is not guaranteed to be accurate and should be independently verified.
![]() All data is obtained from various sources and may not have been verified by broker or MLS GRID. Supplied Open House Information is subject to change without notice. All information should be independently reviewed and verified for accuracy. Properties may or may not be listed by the office/agent presenting the information. Some IDX listings have been excluded from this website.
All data is obtained from various sources and may not have been verified by broker or MLS GRID. Supplied Open House Information is subject to change without notice. All information should be independently reviewed and verified for accuracy. Properties may or may not be listed by the office/agent presenting the information. Some IDX listings have been excluded from this website.
Listings courtesy of Midwest Real Estate Data (MRED) as distributed by MLS GRID.
Based on information submitted to the MLS GRID
Ask me questions while you tour the home.