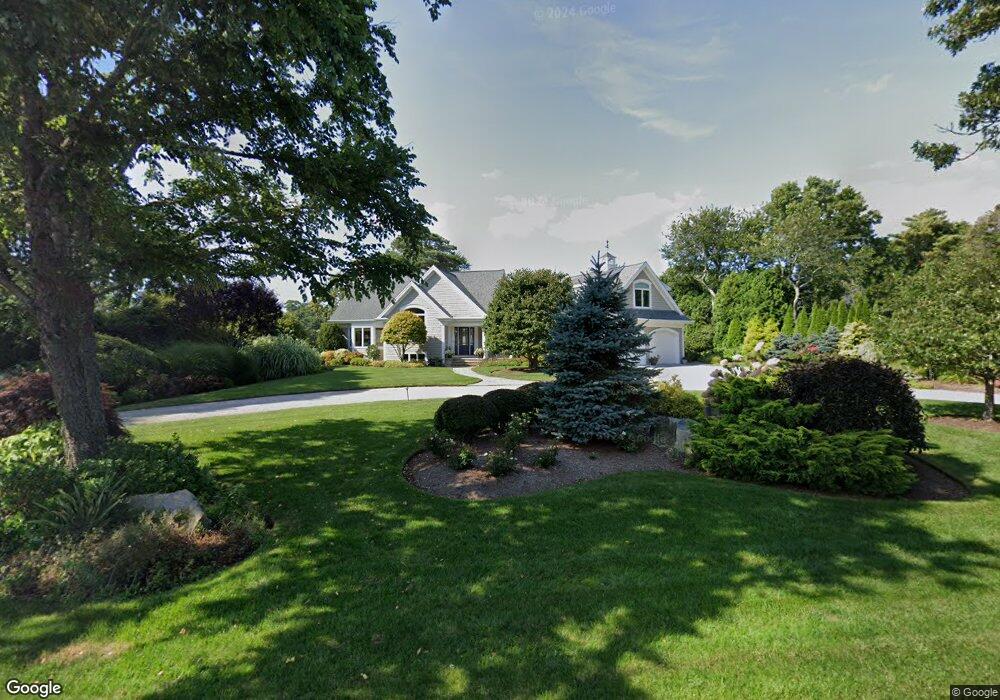
109 Strong Island Rd Chatham, MA 02633
North Chatham NeighborhoodEstimated Value: $2,262,000 - $3,789,000
3
Beds
3
Baths
1,801
Sq Ft
$1,701/Sq Ft
Est. Value
About This Home
This home is located at 109 Strong Island Rd, Chatham, MA 02633 and is currently estimated at $3,063,744, approximately $1,701 per square foot. 109 Strong Island Rd is a home located in Barnstable County with nearby schools including Chatham Elementary School, Harwich Elementary School, and Monomoy Regional Middle School.
Ownership History
Date
Name
Owned For
Owner Type
Purchase Details
Closed on
Jun 7, 2007
Sold by
Hoynacki Sharon A
Bought by
Sharon A Hoynacki Lt
Current Estimated Value
Purchase Details
Closed on
Jul 28, 2003
Sold by
Rich Chatham T
Bought by
Hoynacki Sharon A
Home Financials for this Owner
Home Financials are based on the most recent Mortgage that was taken out on this home.
Original Mortgage
$1,000,000
Interest Rate
5.27%
Mortgage Type
Purchase Money Mortgage
Create a Home Valuation Report for This Property
The Home Valuation Report is an in-depth analysis detailing your home's value as well as a comparison with similar homes in the area
Home Values in the Area
Average Home Value in this Area
Purchase History
| Date | Buyer | Sale Price | Title Company |
|---|---|---|---|
| Sharon A Hoynacki Lt | -- | -- | |
| Hoynacki Sharon A | $1,450,000 | -- |
Source: Public Records
Mortgage History
| Date | Status | Borrower | Loan Amount |
|---|---|---|---|
| Previous Owner | Hoynacki Sharon A | $1,000,000 |
Source: Public Records
Tax History Compared to Growth
Tax History
| Year | Tax Paid | Tax Assessment Tax Assessment Total Assessment is a certain percentage of the fair market value that is determined by local assessors to be the total taxable value of land and additions on the property. | Land | Improvement |
|---|---|---|---|---|
| 2025 | $10,560 | $3,043,300 | $1,566,900 | $1,476,400 |
| 2024 | $10,310 | $2,887,900 | $1,478,300 | $1,409,600 |
| 2023 | $9,812 | $2,528,900 | $1,231,800 | $1,297,100 |
| 2022 | $9,887 | $2,140,100 | $1,231,800 | $908,300 |
| 2021 | $9,738 | $1,955,400 | $1,119,600 | $835,800 |
| 2020 | $9,467 | $1,964,100 | $1,119,600 | $844,500 |
| 2019 | $9,216 | $1,900,300 | $1,046,700 | $853,600 |
| 2018 | $8,879 | $1,823,200 | $1,046,700 | $776,500 |
| 2017 | $9,967 | $1,981,600 | $1,219,300 | $762,300 |
| 2016 | $10,091 | $2,010,200 | $1,182,600 | $827,600 |
| 2015 | $9,513 | $1,906,400 | $1,148,900 | $757,500 |
| 2014 | $9,528 | $1,875,600 | $1,148,900 | $726,700 |
Source: Public Records
Map
Nearby Homes
- 558 Fox Hill Rd
- 174 Seapine Rd
- 2 Seapine Rd
- 0 Crows Pond Rd
- 238 Cranberry Ln
- 597 Orleans Rd
- 99 A Leonard Way
- 28 Cranberry Ln
- 28 Cranberry Ln
- 109 Misty Meadow Ln Unit 2
- 109 Misty Meadow Ln Unit 4
- 785 Old Harbor Rd
- 111 Enterprise Dr
- 2079 Head of The Bay Rd
- 44 Emery Ln
- 355 Training Field Rd
- 39 Meadow Brook Rd
- 207 Horizon Dr
- 4 Ministers Ln
- 123 Strong Island Rd
- 95 Strong Island Rd
- 137 Strong Island Rd
- 69 Strong Island Rd
- 23 Sedge Ln
- 70 Strong Island Rd
- 165 Strong Island Rd
- 146 Strong Island Rd
- 8 Bassing Harbor Rd
- 55 Strong Island Rd
- 164 Strong Island Rd
- 58 Strong Island Rd
- 119 Eastward Rd
- 21 Bassing Harbor Rd
- 94 Eastward Rd
- 76 Eastward Rd
- 9 Bassing Harbor Rd
- 60 Eastward Rd
- 178 Strong Island Rd
- 28 Sedge Ln