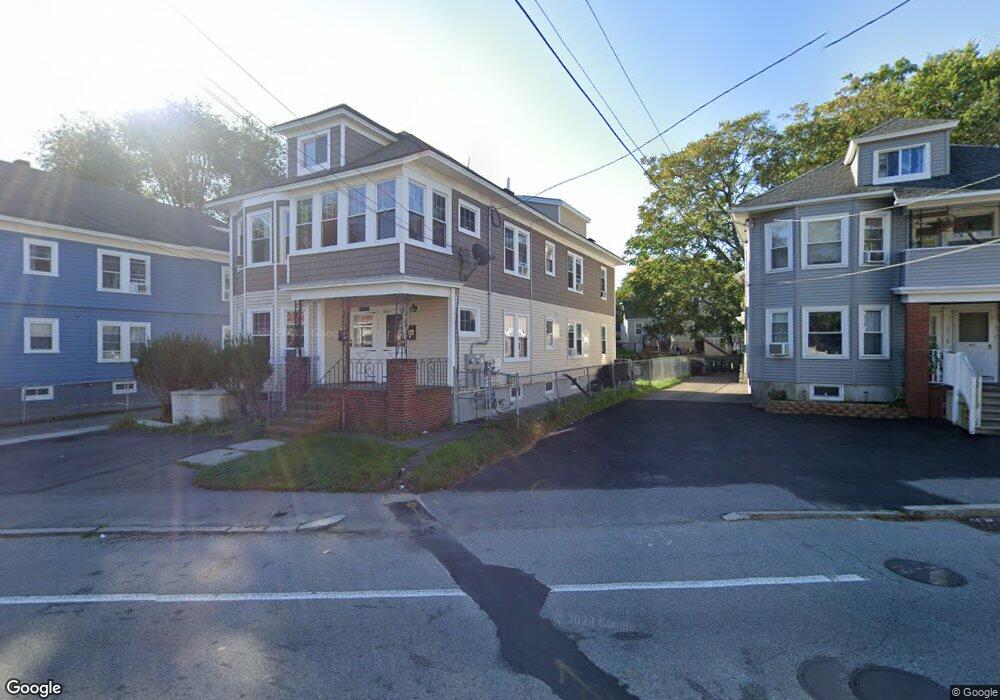
109 Swan St Unit 111 Methuen, MA 01844
The East End NeighborhoodEstimated Value: $812,916 - $861,000
8
Beds
4
Baths
3,366
Sq Ft
$247/Sq Ft
Est. Value
About This Home
This home is located at 109 Swan St Unit 111, Methuen, MA 01844 and is currently estimated at $830,979, approximately $246 per square foot. 109 Swan St Unit 111 is a home located in Essex County with nearby schools including Timony Grammar School, South Point Elementary School, and Methuen High School.
Ownership History
Date
Name
Owned For
Owner Type
Purchase Details
Closed on
Jan 28, 2019
Sold by
Mariano Domenic Est and Mariano
Bought by
Quillay-Apuango Santos C
Current Estimated Value
Home Financials for this Owner
Home Financials are based on the most recent Mortgage that was taken out on this home.
Original Mortgage
$440,185
Outstanding Balance
$384,389
Interest Rate
4.37%
Mortgage Type
FHA
Estimated Equity
$446,590
Purchase Details
Closed on
Oct 1, 1966
Bought by
Mariano Domenic
Create a Home Valuation Report for This Property
The Home Valuation Report is an in-depth analysis detailing your home's value as well as a comparison with similar homes in the area
Home Values in the Area
Average Home Value in this Area
Purchase History
| Date | Buyer | Sale Price | Title Company |
|---|---|---|---|
| Quillay-Apuango Santos C | $453,000 | -- | |
| Quillay-Apuango Santos C | $453,000 | -- | |
| Quillay-Apuango Santos C | $453,000 | -- | |
| Mariano Domenic | -- | -- |
Source: Public Records
Mortgage History
| Date | Status | Borrower | Loan Amount |
|---|---|---|---|
| Open | Quillay-Apuango Santos C | $440,185 | |
| Closed | Quillay-Apuango Santos C | $440,185 |
Source: Public Records
Tax History Compared to Growth
Tax History
| Year | Tax Paid | Tax Assessment Tax Assessment Total Assessment is a certain percentage of the fair market value that is determined by local assessors to be the total taxable value of land and additions on the property. | Land | Improvement |
|---|---|---|---|---|
| 2025 | $7,985 | $754,700 | $176,400 | $578,300 |
| 2024 | $7,295 | $671,700 | $160,400 | $511,300 |
| 2023 | $6,878 | $587,900 | $140,300 | $447,600 |
| 2022 | $6,145 | $470,900 | $120,300 | $350,600 |
| 2021 | $5,876 | $445,500 | $113,600 | $331,900 |
| 2020 | $5,609 | $417,300 | $113,600 | $303,700 |
| 2019 | $5,167 | $364,100 | $106,900 | $257,200 |
| 2018 | $4,779 | $334,900 | $100,200 | $234,700 |
| 2017 | $4,587 | $313,100 | $93,500 | $219,600 |
| 2016 | $4,175 | $281,900 | $86,900 | $195,000 |
| 2015 | $3,764 | $257,800 | $72,200 | $185,600 |
Source: Public Records
Map
Nearby Homes
- 24 Boylston St
- 24 Court St
- 15 Swan Ave
- 20 Knox St Unit 43
- 20 Knox St Unit 23
- 9 Boylston St
- 35 Swan Ave
- 35 Kendall St
- 6 Longwood Dr
- 167 Ferry 53 Mann St Unit 2,5,6
- 63 Lippold St
- 68 Wesley St
- 7 Magnolia Rd
- 100-102 E Haverhill St
- 4 Alderbrook Ln
- 169 Berkeley St
- 5 Harmony Ln
- 183 Berkeley St
- 106 Leroy Ave
- 29 Meadowbrook Rd
- 109-111 Swan St
- 113 Swan St Unit 115
- 105-107 Swan St
- 105 Swan St Unit 107
- 105 Swan St Unit 1
- 107 Swan St
- 101 Swan St Unit 103
- 8 Olive St Unit 10
- 14 Olive St
- 99 1/2 Boston St
- 12 Olive St
- 97 Swan St Unit 99
- 97-99 Swan St
- 97 1/2 Boston St
- 99 Boston St
- 95 Boston St
- 97 Boston St
- 105 Boston St Unit 107
- 105-107 Boston St
- 96 Swan St Unit 98