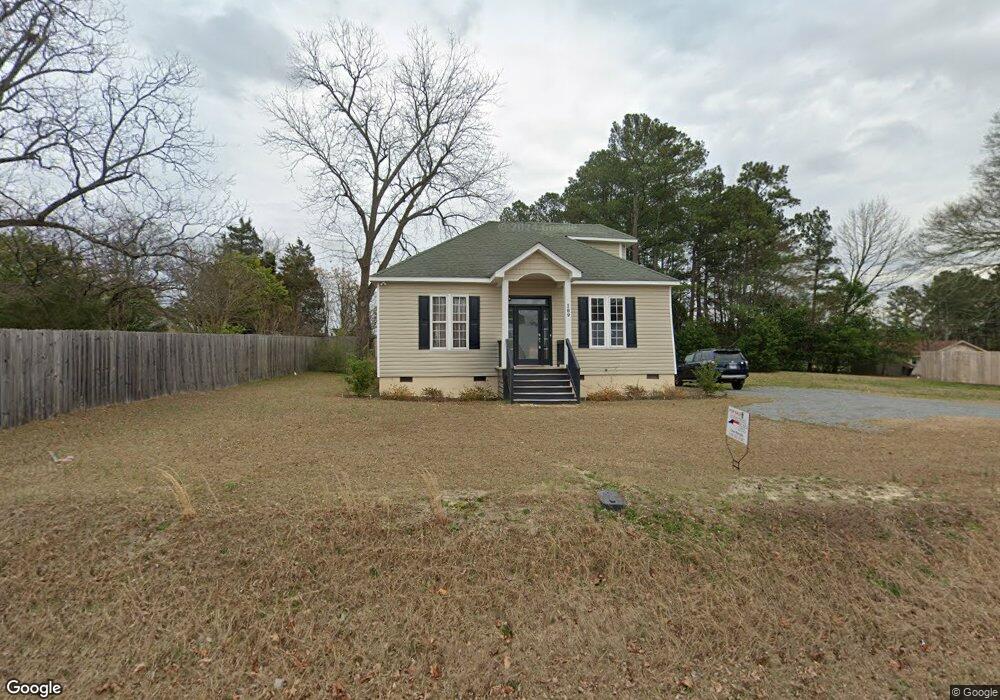
109 Vass-Carthage Rd Carthage, NC 28327
Estimated Value: $256,000 - $285,000
1
Bed
2
Baths
1,168
Sq Ft
$226/Sq Ft
Est. Value
About This Home
This home is located at 109 Vass-Carthage Rd, Carthage, NC 28327 and is currently estimated at $264,352, approximately $226 per square foot. 109 Vass-Carthage Rd is a home located in Moore County with nearby schools including Carthage Elementary School, New Century Middle School, and Union Pines High School.
Ownership History
Date
Name
Owned For
Owner Type
Purchase Details
Closed on
May 2, 2024
Sold by
Laur Linda
Bought by
Dye Aaron and Dye Jill
Current Estimated Value
Purchase Details
Closed on
Oct 21, 2022
Sold by
Grist Lucy C and Grist Samuel L
Bought by
Laur Linda
Home Financials for this Owner
Home Financials are based on the most recent Mortgage that was taken out on this home.
Original Mortgage
$205,000
Interest Rate
6.7%
Mortgage Type
VA
Purchase Details
Closed on
Jun 29, 2022
Sold by
Frye David W and Frye Margaret W
Bought by
Grist Lucy C
Purchase Details
Closed on
Jun 15, 2022
Sold by
Williams & Hess Ltd
Bought by
Frye David
Purchase Details
Closed on
Jul 10, 2012
Sold by
Williams & Hess Ltd
Bought by
Frye David
Purchase Details
Closed on
Jul 6, 2010
Sold by
Williams Jonathan H and Williams Cheryl H
Bought by
Williams & Hess Ltd
Create a Home Valuation Report for This Property
The Home Valuation Report is an in-depth analysis detailing your home's value as well as a comparison with similar homes in the area
Home Values in the Area
Average Home Value in this Area
Purchase History
| Date | Buyer | Sale Price | Title Company |
|---|---|---|---|
| Dye Aaron | $267,000 | None Listed On Document | |
| Laur Linda | $250,000 | -- | |
| Grist Lucy C | $60,000 | Thigpen And Jenkins Llp | |
| Frye David | -- | Thigpen And Jenkins Llp | |
| Frye David | $22,000 | None Available | |
| Williams & Hess Ltd | -- | None Available |
Source: Public Records
Mortgage History
| Date | Status | Borrower | Loan Amount |
|---|---|---|---|
| Previous Owner | Laur Linda | $205,000 |
Source: Public Records
Tax History Compared to Growth
Tax History
| Year | Tax Paid | Tax Assessment Tax Assessment Total Assessment is a certain percentage of the fair market value that is determined by local assessors to be the total taxable value of land and additions on the property. | Land | Improvement |
|---|---|---|---|---|
| 2024 | $1,977 | $231,880 | $32,010 | $199,870 |
| 2023 | $1,631 | $231,880 | $32,010 | $199,870 |
| 2022 | $372 | $36,070 | $11,880 | $24,190 |
| 2021 | $381 | $36,070 | $11,880 | $24,190 |
| 2020 | $384 | $36,070 | $11,880 | $24,190 |
| 2019 | $384 | $36,070 | $11,880 | $24,190 |
| 2018 | $347 | $34,670 | $11,880 | $22,790 |
| 2017 | $343 | $34,670 | $11,880 | $22,790 |
| 2015 | $340 | $34,670 | $11,880 | $22,790 |
| 2014 | $336 | $36,700 | $15,520 | $21,180 |
| 2013 | -- | $36,700 | $15,520 | $21,180 |
Source: Public Records
Map
Nearby Homes
- 110 Bingham St
- 801 Monroe St
- 207 Bingham St
- TBA Morgan St
- 0 Currie St
- TBD Currie St
- 510 Pinehurst Ave
- 104 Rockingham St
- 926 Ocean Ct
- 424 Bingham St
- 202 Martin St
- 106 W Barrett St
- 445 Albion Ct
- Hamel Plan at Carriage Hills
- Grenoble Plan at Carriage Hills
- Lyon Plan at Carriage Hills
- 154 Carver St
- 253 Martin St
- 148 Carver St
- Hayden Plan at Southbury
- 109 Vass Carthage Rd
- 111 Vass Carthage Rd
- 105 Vass Carthage Rd
- 110 Black St
- 113 Vass Carthage Rd
- 104 Black St
- 106 Bingham St
- 108 Bingham St
- 610 Parks St
- 704 Saunders St
- 605 Saunders St
- 702 Saunders St
- 608 E Saunders St
- 606 Parks St
- 0 Parks St
- 603 Saunders St
- 203 Bingham St
- 601 Saunders St
- 606 Saunders St
- 103 Clark St