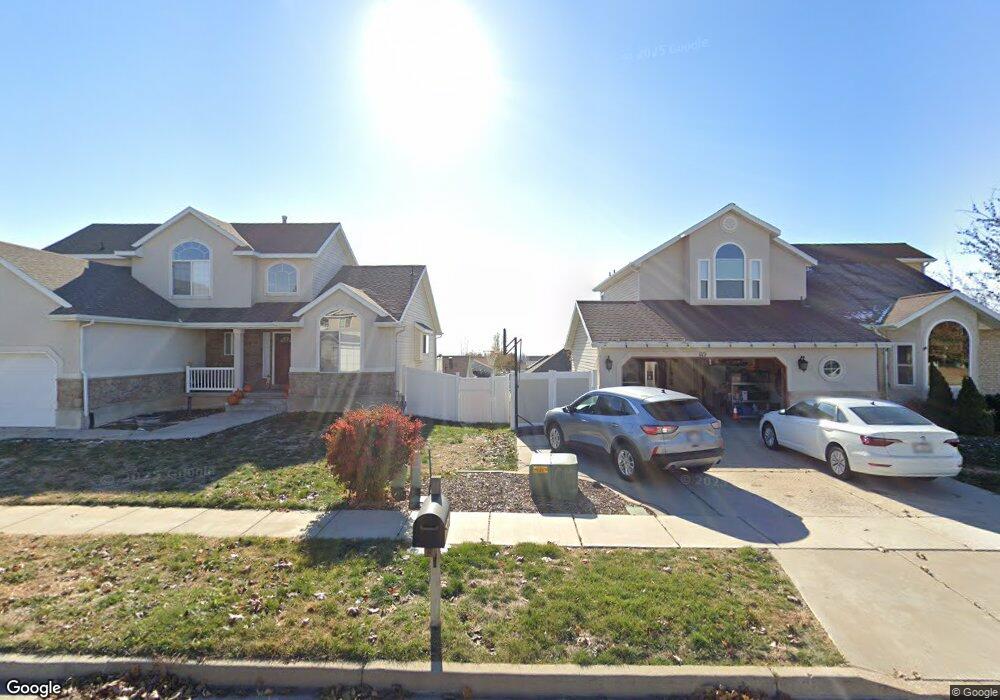
109 W 2300 N Clearfield, UT 84015
Estimated Value: $353,000 - $451,000
--
Bed
2
Baths
2,556
Sq Ft
$165/Sq Ft
Est. Value
About This Home
This home is located at 109 W 2300 N, Clearfield, UT 84015 and is currently estimated at $420,588, approximately $164 per square foot. 109 W 2300 N is a home located in Davis County with nearby schools including Sunset School, Sunset Junior High School, and Northridge High School.
Ownership History
Date
Name
Owned For
Owner Type
Purchase Details
Closed on
Dec 5, 2013
Sold by
Huerta Albert and Huerta Charlys E
Bought by
Huerta Albert
Current Estimated Value
Purchase Details
Closed on
Dec 20, 2001
Sold by
Huerta Albert and Huerta Charlys Elaine Russell
Bought by
Huerta Albert and Huerta Charlys E
Home Financials for this Owner
Home Financials are based on the most recent Mortgage that was taken out on this home.
Original Mortgage
$85,000
Interest Rate
5.96%
Purchase Details
Closed on
Oct 30, 1997
Sold by
Romero Albert and Romero Charlys Elaine
Bought by
Huerta Albert and Huerta Charlys Elaine Russell
Home Financials for this Owner
Home Financials are based on the most recent Mortgage that was taken out on this home.
Original Mortgage
$85,500
Interest Rate
7.26%
Create a Home Valuation Report for This Property
The Home Valuation Report is an in-depth analysis detailing your home's value as well as a comparison with similar homes in the area
Home Values in the Area
Average Home Value in this Area
Purchase History
| Date | Buyer | Sale Price | Title Company |
|---|---|---|---|
| Huerta Albert | -- | Eagle Gate Title Ins Agn | |
| Huerta Albert | -- | Bonneville Title Company Inc | |
| Huerta Albert | -- | Inwest Title Services Inc |
Source: Public Records
Mortgage History
| Date | Status | Borrower | Loan Amount |
|---|---|---|---|
| Closed | Huerta Albert | $85,000 | |
| Closed | Huerta Albert | $85,500 |
Source: Public Records
Tax History
| Year | Tax Paid | Tax Assessment Tax Assessment Total Assessment is a certain percentage of the fair market value that is determined by local assessors to be the total taxable value of land and additions on the property. | Land | Improvement |
|---|---|---|---|---|
| 2025 | $2,442 | $222,750 | $59,893 | $162,857 |
| 2024 | $2,225 | $202,950 | $57,723 | $145,227 |
| 2023 | $2,086 | $347,000 | $114,757 | $232,243 |
| 2022 | $2,236 | $201,300 | $65,144 | $136,156 |
| 2021 | $1,915 | $271,000 | $72,791 | $198,209 |
| 2020 | $1,674 | $233,000 | $61,911 | $171,089 |
| 2019 | $1,535 | $219,000 | $74,370 | $144,630 |
| 2018 | $1,374 | $192,000 | $59,432 | $132,568 |
| 2016 | $1,181 | $84,755 | $28,121 | $56,634 |
| 2015 | $1,233 | $83,875 | $28,121 | $55,754 |
| 2014 | $1,168 | $81,198 | $28,121 | $53,077 |
| 2013 | -- | $71,394 | $23,265 | $48,129 |
Source: Public Records
Map
Nearby Homes
- 2237 N 125 W
- 158 W 2200 N
- 129 W 2200 N
- 2101 N Main St Unit 205
- 2129 N 250 W
- 2085 N Main St Unit 309
- 2085 N Main St Unit 102
- 2085 N Main St Unit 409
- 2085 N Main St Unit 107
- 2085 N Main St Unit 108
- 2085 N Main St Unit 115
- 2085 N Main St Unit 110
- 2085 N Main St Unit 201
- 2085 N Main St Unit 301
- 2085 N Main St Unit 302
- 2085 N Main St Unit 215
- 2085 N Main St Unit 303
- 345 W 2300 N
- 2358 N 400 W
- 52 W 2000 N
Your Personal Tour Guide
Ask me questions while you tour the home.