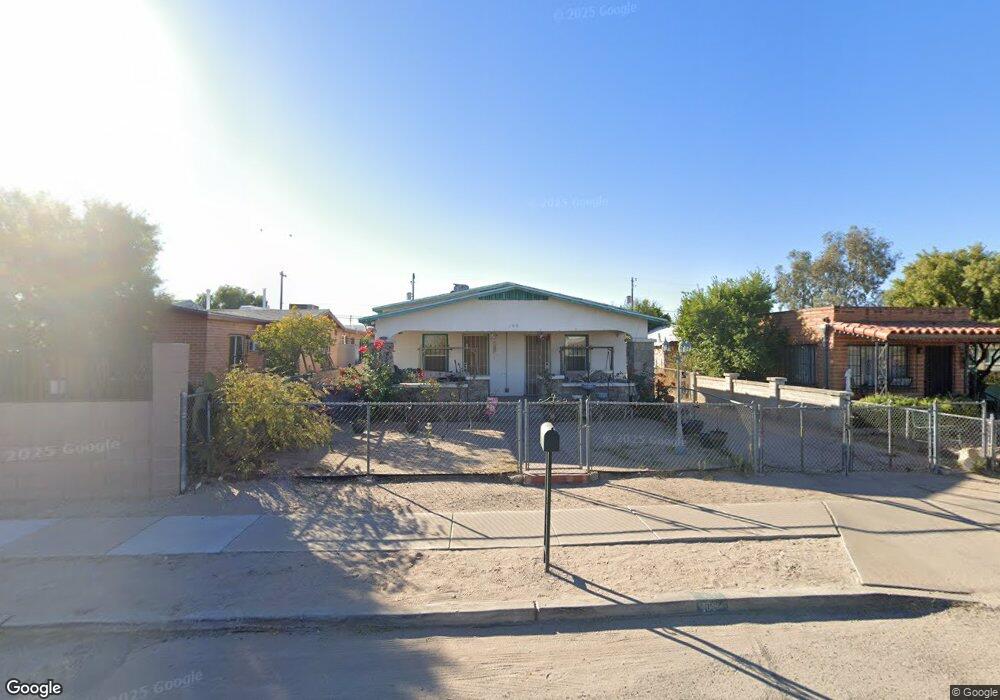
109 W 31st St Tucson, AZ 85713
Estimated Value: $183,000 - $301,000
Studio
1
Bath
1,370
Sq Ft
$164/Sq Ft
Est. Value
About This Home
This home is located at 109 W 31st St, Tucson, AZ 85713 and is currently estimated at $224,609, approximately $163 per square foot. 109 W 31st St is a home located in Pima County with nearby schools including Ochoa Elementary School, Tucson High Magnet School, and Las Puertas Community School.
Ownership History
Date
Name
Owned For
Owner Type
Purchase Details
Closed on
Apr 25, 2002
Sold by
Mendoza Consuelo G and Mendoza David E
Bought by
Mendoza David E and Mendoza Consuelo G
Current Estimated Value
Home Financials for this Owner
Home Financials are based on the most recent Mortgage that was taken out on this home.
Original Mortgage
$46,796
Outstanding Balance
$19,245
Interest Rate
7.13%
Estimated Equity
$205,364
Purchase Details
Closed on
Jun 9, 1997
Sold by
Mendoza Consuelo G
Bought by
Mendoza Consuelo G and Mendoza David E
Purchase Details
Closed on
Mar 15, 1995
Sold by
Bermudez Manuel L and Bermudez Cecilia A
Bought by
Mendoza Consuelo G
Home Financials for this Owner
Home Financials are based on the most recent Mortgage that was taken out on this home.
Original Mortgage
$46,523
Interest Rate
9.03%
Mortgage Type
FHA
Purchase Details
Closed on
Oct 20, 1994
Sold by
Jacques Delia
Bought by
Bermudez Manuel L and Bermudez Cecilia A
Create a Home Valuation Report for This Property
The Home Valuation Report is an in-depth analysis detailing your home's value as well as a comparison with similar homes in the area
Home Values in the Area
Average Home Value in this Area
Purchase History
| Date | Buyer | Sale Price | Title Company |
|---|---|---|---|
| Mendoza David E | -- | -- | |
| Mendoza Consuelo G | -- | -- | |
| Mendoza Consuelo G | $46,500 | -- | |
| Bermudez Manuel L | $21,000 | -- |
Source: Public Records
Mortgage History
| Date | Status | Borrower | Loan Amount |
|---|---|---|---|
| Open | Mendoza David E | $46,796 | |
| Closed | Mendoza Consuelo G | $46,523 |
Source: Public Records
Tax History
| Year | Tax Paid | Tax Assessment Tax Assessment Total Assessment is a certain percentage of the fair market value that is determined by local assessors to be the total taxable value of land and additions on the property. | Land | Improvement |
|---|---|---|---|---|
| 2026 | $1,111 | $8,789 | -- | -- |
| 2025 | $1,111 | $8,370 | -- | -- |
| 2024 | $870 | $7,972 | -- | -- |
| 2023 | $814 | $7,592 | $0 | $0 |
| 2022 | $797 | $7,231 | $0 | $0 |
| 2021 | $812 | $6,558 | $0 | $0 |
| 2020 | $785 | $6,558 | $0 | $0 |
| 2019 | $768 | $10,123 | $0 | $0 |
| 2018 | $732 | $5,665 | $0 | $0 |
| 2017 | $697 | $5,665 | $0 | $0 |
| 2016 | $676 | $5,396 | $0 | $0 |
| 2015 | $647 | $5,139 | $0 | $0 |
Source: Public Records
Map
Nearby Homes
Your Personal Tour Guide
Ask me questions while you tour the home.