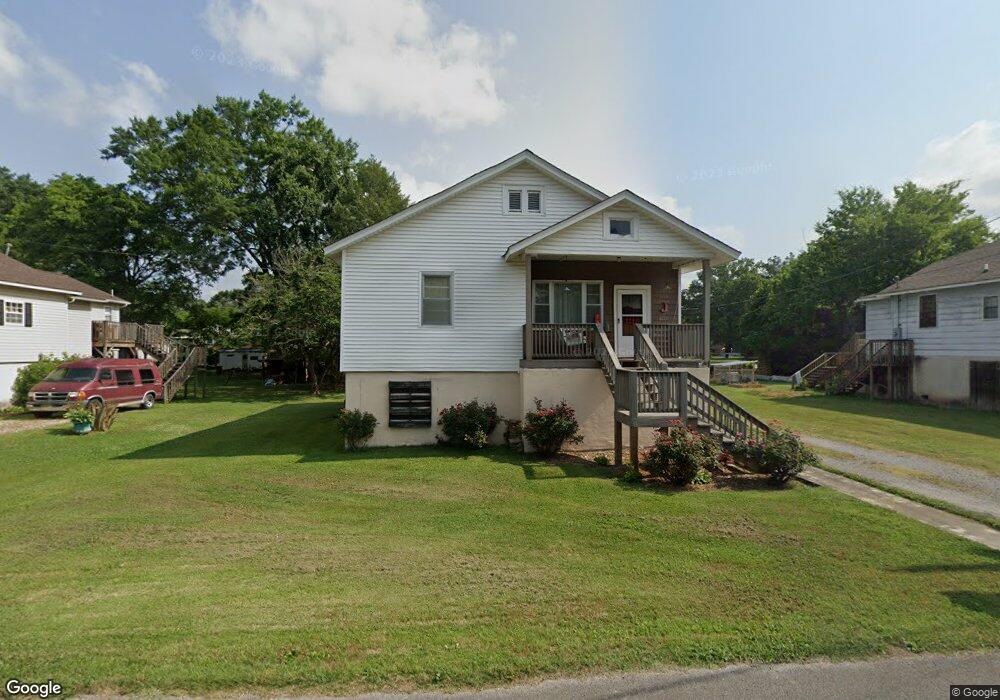
109 W 9th St Chickamauga, GA 30707
Estimated Value: $202,000 - $243,000
2
Beds
2
Baths
1,176
Sq Ft
$186/Sq Ft
Est. Value
About This Home
This home is located at 109 W 9th St, Chickamauga, GA 30707 and is currently estimated at $219,272, approximately $186 per square foot. 109 W 9th St is a home located in Walker County with nearby schools including Chickamauga Elementary School, Gordon Lee Middle School, and Gordon Lee High School.
Ownership History
Date
Name
Owned For
Owner Type
Purchase Details
Closed on
Mar 30, 2007
Sold by
Not Provided
Bought by
Johnson Finley D and Johnson Lynne W
Current Estimated Value
Home Financials for this Owner
Home Financials are based on the most recent Mortgage that was taken out on this home.
Original Mortgage
$92,055
Outstanding Balance
$55,659
Interest Rate
6.15%
Mortgage Type
New Conventional
Estimated Equity
$163,613
Purchase Details
Closed on
Jul 31, 2001
Sold by
Waters J Ernest
Bought by
Gant Diona M
Purchase Details
Closed on
Jan 1, 1972
Bought by
Waters J Ernest
Create a Home Valuation Report for This Property
The Home Valuation Report is an in-depth analysis detailing your home's value as well as a comparison with similar homes in the area
Home Values in the Area
Average Home Value in this Area
Purchase History
| Date | Buyer | Sale Price | Title Company |
|---|---|---|---|
| Johnson Finley D | $93,500 | -- | |
| Gant Diona M | $57,900 | -- | |
| Waters J Ernest | -- | -- |
Source: Public Records
Mortgage History
| Date | Status | Borrower | Loan Amount |
|---|---|---|---|
| Open | Johnson Finley D | $92,055 |
Source: Public Records
Tax History
| Year | Tax Paid | Tax Assessment Tax Assessment Total Assessment is a certain percentage of the fair market value that is determined by local assessors to be the total taxable value of land and additions on the property. | Land | Improvement |
|---|---|---|---|---|
| 2024 | $1,738 | $75,296 | $14,830 | $60,466 |
| 2023 | $1,711 | $71,945 | $14,830 | $57,115 |
| 2022 | $630 | $53,310 | $14,830 | $38,480 |
| 2021 | $575 | $39,960 | $14,830 | $25,130 |
| 2020 | $570 | $35,848 | $14,830 | $21,018 |
| 2019 | $570 | $35,848 | $14,830 | $21,018 |
| 2018 | $471 | $35,848 | $14,830 | $21,018 |
| 2017 | $716 | $35,848 | $14,830 | $21,018 |
| 2016 | $450 | $29,288 | $14,830 | $14,458 |
| 2015 | $526 | $34,332 | $4,564 | $29,768 |
| 2014 | $424 | $34,332 | $4,564 | $29,768 |
| 2013 | -- | $34,332 | $4,564 | $29,768 |
Source: Public Records
Map
Nearby Homes
- 102 W 8th St
- 130 Krystal Dr
- 8 W 8th St
- 74 Cove Rd
- 80 Cove Rd
- 107 Wilder Ave
- 305 Gordon St
- 508 E 14th St
- 107 Hamel Dr
- 801 Thomas Ave
- 138 Dana Ln
- 0 W 12th St Unit 1526508
- 301 Clebourne Ave
- 409 Elder Ave
- 102 Dogwood Trail
- 0 Rogers Rd Unit 1526382
- 661 Jill Ln
- 232 E Tennant Cir
- 1527 Glass Mill Rd
- 201 E Tennant Cir