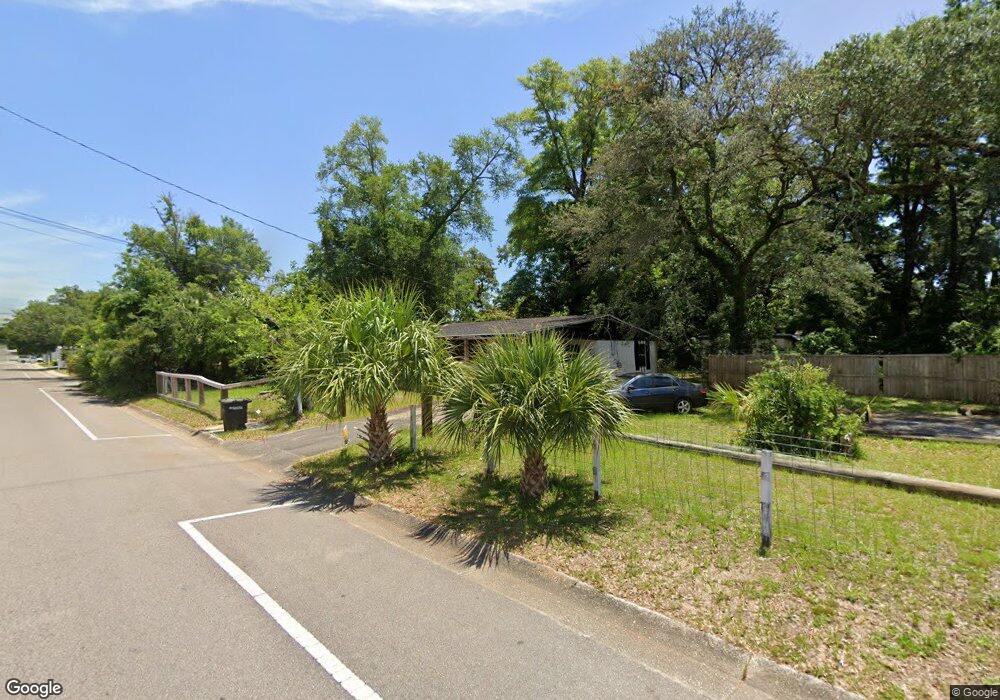
109 W Maxwell St Pensacola, FL 32501
Estimated Value: $183,558 - $293,000
--
Bed
1
Bath
1,436
Sq Ft
$169/Sq Ft
Est. Value
About This Home
This home is located at 109 W Maxwell St, Pensacola, FL 32501 and is currently estimated at $242,390, approximately $168 per square foot. 109 W Maxwell St is a home located in Escambia County with nearby schools including O.J. Semmes Elementary School, J.H. Workman Middle School, and Pensacola High School.
Ownership History
Date
Name
Owned For
Owner Type
Purchase Details
Closed on
Jan 1, 2007
Sold by
Lewis Lillie Mae
Bought by
Lewis Brown Laangela
Current Estimated Value
Purchase Details
Closed on
Sep 24, 2003
Sold by
Brown Laangela M and Lewis Laangela M
Bought by
Lewis Lillie M and Stanton Willie Lee
Home Financials for this Owner
Home Financials are based on the most recent Mortgage that was taken out on this home.
Original Mortgage
$33,000
Interest Rate
6.45%
Create a Home Valuation Report for This Property
The Home Valuation Report is an in-depth analysis detailing your home's value as well as a comparison with similar homes in the area
Home Values in the Area
Average Home Value in this Area
Purchase History
| Date | Buyer | Sale Price | Title Company |
|---|---|---|---|
| Lewis Brown Laangela | $10,000 | None Available | |
| Lewis Lillie M | $7,700 | -- |
Source: Public Records
Mortgage History
| Date | Status | Borrower | Loan Amount |
|---|---|---|---|
| Previous Owner | Lewis Lillie M | $33,000 |
Source: Public Records
Tax History Compared to Growth
Tax History
| Year | Tax Paid | Tax Assessment Tax Assessment Total Assessment is a certain percentage of the fair market value that is determined by local assessors to be the total taxable value of land and additions on the property. | Land | Improvement |
|---|---|---|---|---|
| 2024 | $1,072 | $104,211 | -- | -- |
| 2023 | $1,072 | $101,176 | $0 | $0 |
| 2022 | $1,032 | $98,230 | $0 | $0 |
| 2021 | $969 | $95,369 | $0 | $0 |
| 2020 | $979 | $94,053 | $0 | $0 |
| 2019 | $951 | $91,939 | $0 | $0 |
| 2018 | $939 | $90,225 | $0 | $0 |
| 2017 | $969 | $90,760 | $0 | $0 |
| 2016 | $951 | $88,894 | $0 | $0 |
| 2015 | $955 | $88,277 | $0 | $0 |
| 2014 | $951 | $87,577 | $0 | $0 |
Source: Public Records
Map
Nearby Homes
- 2005 N Baylen St
- 9 W Yonge St
- 100 W Scott St
- 1806 N Barcelona St
- 100 E Maxwell St
- 110 E Jordan St
- 114 E Maxwell St
- 110 E Bobe St
- 631 W Jordan St
- 2014 N Tarragona St
- 200 E Yonge St
- 1750 N Reus St
- 1910 N Tarragona St
- 2514 N Guillemard St
- 215 E Bobe St
- 1609 N Spring St
- 811 W Jordan St
- 213 E Yonge St
- 1517 N Spring St
- 2329 N Hayne St
- 2121 N Baylen St
- 2110 N Spring St
- 2108 N Spring St
- 2106 N Spring St
- 2100 N Spring St
- 2109 N Spring St
- 2017 N Baylen St
- 14 W Jordan St Unit E
- 14 W Jordan St Unit D
- 14 W Jordan St Unit C
- 14 W Jordan St Unit B
- 14 W Jordan St Unit A
- 14 W Jordan St Unit 2E & 2F
- 14 W Jordan St
- 2103 N Spring St
- 111 W Jordan St
- 50 W Maxwell St
- 115 W Jordan St
- 2101 N Spring St
- 2013 N Baylen St