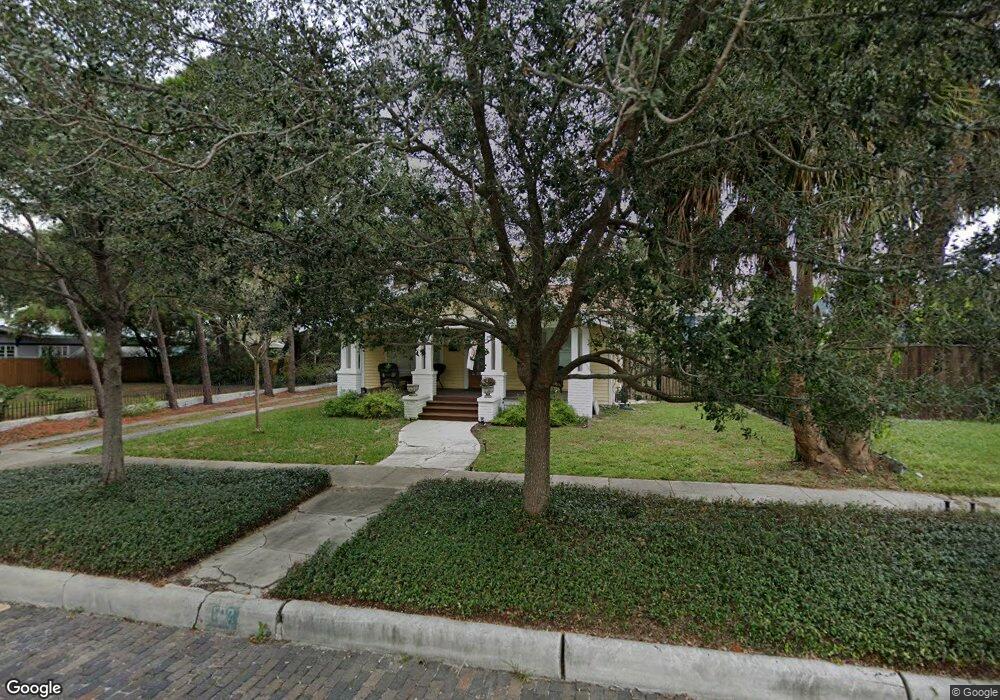
109 W Mohawk Ave Tampa, FL 33604
Seminole Heights NeighborhoodEstimated Value: $443,000 - $574,000
3
Beds
1
Bath
1,470
Sq Ft
$348/Sq Ft
Est. Value
About This Home
This home is located at 109 W Mohawk Ave, Tampa, FL 33604 and is currently estimated at $510,950, approximately $347 per square foot. 109 W Mohawk Ave is a home located in Hillsborough County with nearby schools including Seminole Elementary School, Memorial Middle School, and Hillsborough High School.
Ownership History
Date
Name
Owned For
Owner Type
Purchase Details
Closed on
Sep 30, 1999
Sold by
Waterman Patricia L
Bought by
Pavan Leticia G
Current Estimated Value
Home Financials for this Owner
Home Financials are based on the most recent Mortgage that was taken out on this home.
Original Mortgage
$106,650
Outstanding Balance
$30,081
Interest Rate
7.89%
Mortgage Type
New Conventional
Estimated Equity
$480,869
Purchase Details
Closed on
Jun 11, 1999
Sold by
Massaro William A
Bought by
Waterman Patricia L
Purchase Details
Closed on
Jan 8, 1999
Sold by
Becknell Denise R and Becknell Douglas
Bought by
Massaro Patricia L
Home Financials for this Owner
Home Financials are based on the most recent Mortgage that was taken out on this home.
Original Mortgage
$89,600
Interest Rate
6.77%
Mortgage Type
New Conventional
Purchase Details
Closed on
Nov 9, 1995
Sold by
Harding John C
Bought by
Harding Denise R
Create a Home Valuation Report for This Property
The Home Valuation Report is an in-depth analysis detailing your home's value as well as a comparison with similar homes in the area
Home Values in the Area
Average Home Value in this Area
Purchase History
We collect this data history from publicly available records. To have your information removed, we recommend requesting removal directly through your county’s website.
| Date | Buyer | Sale Price | Title Company |
|---|---|---|---|
| Pavan Leticia G | $118,500 | -- | |
| Waterman Patricia L | $100 | -- | |
| Massaro Patricia L | $112,000 | -- | |
| Harding Denise R | $100 | -- |
Source: Public Records
Mortgage History
We collect this data history from publicly available records. To have your information removed, we recommend requesting removal directly through your county’s website.
| Date | Status | Borrower | Loan Amount |
|---|---|---|---|
| Open | Harding Denise R | $37,000 | |
| Open | Harding Denise R | $106,650 | |
| Previous Owner | Harding Denise R | $89,600 |
Source: Public Records
Tax History
| Year | Tax Paid | Tax Assessment Tax Assessment Total Assessment is a certain percentage of the fair market value that is determined by local assessors to be the total taxable value of land and additions on the property. | Land | Improvement |
|---|---|---|---|---|
| 2025 | $5,003 | $308,874 | -- | -- |
| 2024 | $5,003 | $300,169 | -- | -- |
| 2023 | $4,874 | $291,426 | $0 | $0 |
| 2022 | $4,741 | $282,938 | $0 | $0 |
| 2021 | $4,680 | $274,697 | $150,586 | $124,111 |
| 2020 | $5,063 | $251,743 | $132,515 | $119,228 |
| 2019 | $4,632 | $226,614 | $101,871 | $124,743 |
| 2018 | $4,900 | $236,631 | $0 | $0 |
| 2017 | $1,408 | $210,787 | $0 | $0 |
| 2016 | $1,359 | $104,275 | $0 | $0 |
| 2015 | $1,345 | $103,550 | $0 | $0 |
| 2014 | $1,309 | $102,728 | $0 | $0 |
| 2013 | -- | $101,210 | $0 | $0 |
Source: Public Records
Map
Nearby Homes
- 105 W Comanche Ave
- 112 W Powhatan Ave
- 111 W Powhatan Ave
- 117 W Giddens Ave
- 121 W Giddens Ave
- 5508 N Branch Ave
- 5709 N Suwanee Ave
- 304 W Henry Ave
- 5602 N Ola Ave
- 206 E Frierson Ave
- 5810 N Suwanee Ave
- 5118 N Branch Ave
- 309 W Rio Vista Ct
- 5202 N Seminole Ave
- 5907 N Ola Ave
- 6002 N Suwanee Ave
- 5914 N Ola Ave
- 303 W Idlewild Ave
- 5205 N Central Ave
- 114 W Wilder Ave
- 105 W Ave
- 105 W Mohawk Ave
- 111 W Mohawk Ave
- 111 W Mohawk Ave Unit 16
- 103 W Mohawk Ave Unit C
- 103 W Mohawk Ave Unit B
- 103 W Mohawk Ave Unit A
- 103 W Mohawk Ave
- 103 E Mohawk Ave Unit A
- 103 E Mohawk Ave Unit B
- 108 W Comanche Ave
- 106 W Comanche Ave
- 110 W Comanche Ave
- 108 W Mohawk Ave
- 113 W Mohawk Ave
- 112 W Comanche Ave
- 106 W Mohawk Ave
- 110 W Mohawk Ave
- 114 W Comanche Ave
- 115 W Mohawk Ave
Your Personal Tour Guide
Ask me questions while you tour the home.