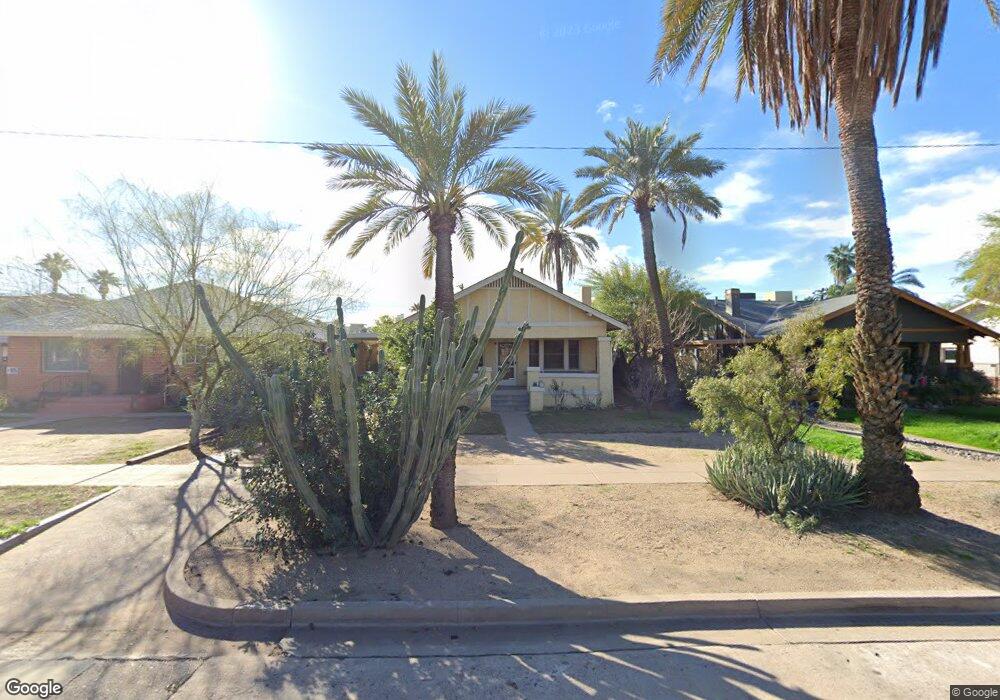
109 W Palm Ln Phoenix, AZ 85003
Willo NeighborhoodEstimated Value: $272,000 - $625,000
Studio
1
Bath
1,065
Sq Ft
$482/Sq Ft
Est. Value
About This Home
This home is located at 109 W Palm Ln, Phoenix, AZ 85003 and is currently estimated at $513,696, approximately $482 per square foot. 109 W Palm Ln is a home located in Maricopa County with nearby schools including Kenilworth Elementary School, Phoenix Coding Academy, and Central High School.
Create a Home Valuation Report for This Property
The Home Valuation Report is an in-depth analysis detailing your home's value as well as a comparison with similar homes in the area
Home Values in the Area
Average Home Value in this Area
Tax History
| Year | Tax Paid | Tax Assessment Tax Assessment Total Assessment is a certain percentage of the fair market value that is determined by local assessors to be the total taxable value of land and additions on the property. | Land | Improvement |
|---|---|---|---|---|
| 2025 | $2,334 | $16,434 | -- | -- |
| 2024 | $2,176 | $15,651 | -- | -- |
| 2023 | $2,176 | $21,535 | $4,305 | $17,230 |
| 2022 | $2,099 | $17,255 | $3,450 | $13,805 |
| 2021 | $2,083 | $16,605 | $3,320 | $13,285 |
| 2020 | $2,107 | $16,015 | $3,200 | $12,815 |
| 2019 | $2,104 | $14,505 | $2,900 | $11,605 |
| 2018 | $2,068 | $14,205 | $2,840 | $11,365 |
| 2017 | $2,020 | $13,455 | $2,690 | $10,765 |
| 2016 | $1,962 | $14,225 | $2,845 | $11,380 |
| 2015 | $1,815 | $13,580 | $2,715 | $10,865 |
Source: Public Records
Map
Nearby Homes
- 2017 N 1st Ave
- 126 W Palm Ln
- 136 W Granada Rd
- 301 W Holly St
- 71 W Cypress St
- 322 W Coronado Rd
- 78 W Cypress St
- 2201 N Central Ave Unit 10C
- 2201 N Central Ave Unit 8C
- 2201 N Central Ave Unit 5E
- 2201 N Central Ave Unit 3D
- 2201 N Central Ave Unit 9D
- 70 W Lynwood St
- 2032 N Alvarado Rd
- 69 W Lynwood St
- 118 E Palm Ln
- 130 E Coronado Rd Unit 16
- 16 W Encanto Blvd Unit 12
- 16 W Encanto Blvd Unit 417
- 16 W Encanto Blvd Unit 22
- 102 W Granada Rd
- 108 W Granada Rd
- 112 W Granada Rd
- 101 W Palm Ln Unit A
- 101 W Palm Ln
- 105 W Palm Ln Unit C
- 105 W Palm Ln Unit A
- 105 W Palm Ln Unit 107
- 105 W Palm Ln Unit 105
- 105 W Palm Ln
- 101 W Granada Rd
- 107 W Palm Ln
- 107 W Granada Rd
- 116 W Granada Rd
- 115 W Palm Ln
- 111 W Granada Rd
- 117 W Palm Ln
- 120 W Granada Rd
- 115 W Granada Rd
- 121 W Palm Ln
Your Personal Tour Guide
Ask me questions while you tour the home.