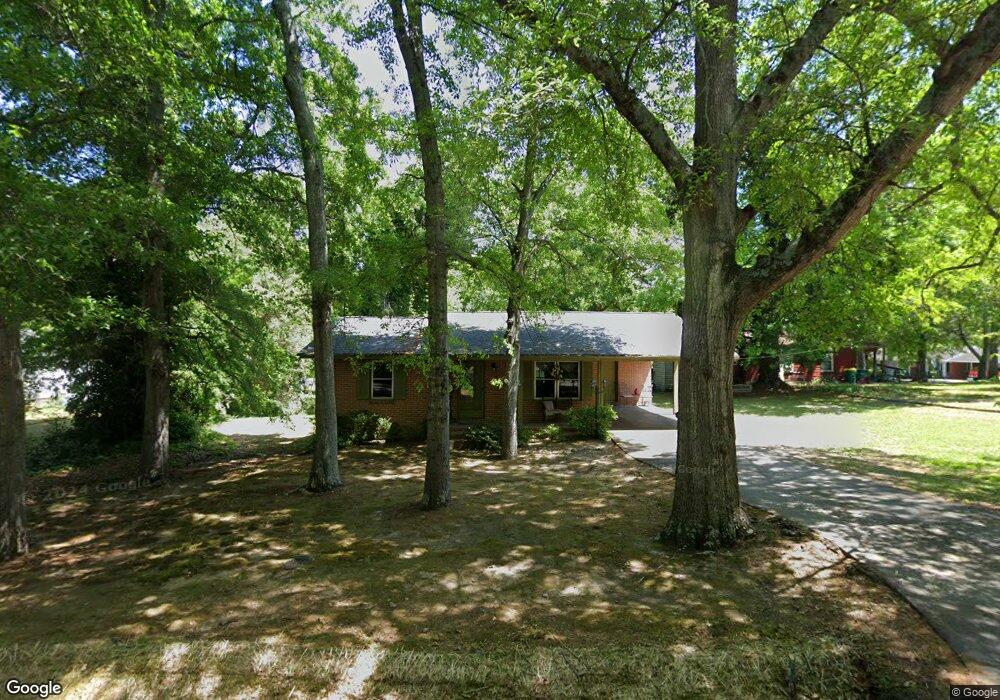
109 W Wright St Winder, GA 30680
Estimated Value: $194,000 - $260,000
2
Beds
1
Bath
858
Sq Ft
$260/Sq Ft
Est. Value
About This Home
This home is located at 109 W Wright St, Winder, GA 30680 and is currently estimated at $222,781, approximately $259 per square foot. 109 W Wright St is a home located in Barrow County with nearby schools including County Line Elementary School, Russell Middle School, and Winder-Barrow High School.
Ownership History
Date
Name
Owned For
Owner Type
Purchase Details
Closed on
Sep 1, 2005
Sold by
Mel-Britt Real Est Inv Inc
Bought by
Fletcher Ralph
Current Estimated Value
Home Financials for this Owner
Home Financials are based on the most recent Mortgage that was taken out on this home.
Original Mortgage
$117,290
Interest Rate
5.86%
Mortgage Type
New Conventional
Purchase Details
Closed on
May 26, 1998
Sold by
Watkins Tara
Bought by
Farmer Tara W And
Purchase Details
Closed on
Nov 2, 1994
Sold by
Bassett Diane
Bought by
Watkins Tara
Home Financials for this Owner
Home Financials are based on the most recent Mortgage that was taken out on this home.
Original Mortgage
$57,500
Interest Rate
8.68%
Purchase Details
Closed on
Jun 26, 1990
Bought by
Drobiazgiewicz Norma
Create a Home Valuation Report for This Property
The Home Valuation Report is an in-depth analysis detailing your home's value as well as a comparison with similar homes in the area
Home Values in the Area
Average Home Value in this Area
Purchase History
| Date | Buyer | Sale Price | Title Company |
|---|---|---|---|
| Fletcher Ralph | $145,900 | -- | |
| Farmer Tara W And | -- | -- | |
| Watkins Tara | $28,500 | -- | |
| Drobiazgiewicz Norma | $47,300 | -- |
Source: Public Records
Mortgage History
| Date | Status | Borrower | Loan Amount |
|---|---|---|---|
| Closed | Fletcher Ralph | $117,290 | |
| Previous Owner | Watkins Tara | $57,500 |
Source: Public Records
Tax History
| Year | Tax Paid | Tax Assessment Tax Assessment Total Assessment is a certain percentage of the fair market value that is determined by local assessors to be the total taxable value of land and additions on the property. | Land | Improvement |
|---|---|---|---|---|
| 2025 | $483 | $61,635 | $22,000 | $39,635 |
| 2024 | $477 | $60,445 | $22,000 | $38,445 |
| 2023 | $322 | $60,445 | $22,000 | $38,445 |
| 2022 | $530 | $47,226 | $16,800 | $30,426 |
| 2021 | $341 | $35,858 | $12,000 | $23,858 |
| 2020 | $386 | $34,920 | $12,000 | $22,920 |
| 2019 | $364 | $30,278 | $12,000 | $18,278 |
| 2018 | $352 | $30,278 | $12,000 | $18,278 |
| 2017 | $744 | $24,948 | $9,600 | $15,348 |
| 2016 | $185 | $25,150 | $9,600 | $15,550 |
| 2015 | $287 | $25,352 | $9,600 | $15,752 |
| 2014 | $79 | $20,860 | $4,704 | $16,156 |
| 2013 | -- | $20,456 | $4,704 | $15,752 |
Source: Public Records
Map
Nearby Homes
- 88 W New St
- 59 W Wright St
- 352 3rd Ave
- 253 3rd Ave
- 284 E 5th Ave
- 0 Jerome St Unit 10359679
- 127 N Center St
- 60 W Williams St
- 206 E 5th Ave
- 17 W Wright St
- 136 Alexander Ct
- 187 Bellview St
- 10 W Wright St
- 160 N Broad St
- 236 6th Ave
- 5 W Kimball St
- 3 W Kimball St
- 1 W Kimball St
- 18 E New St
- 217 Bellview St
Your Personal Tour Guide
Ask me questions while you tour the home.