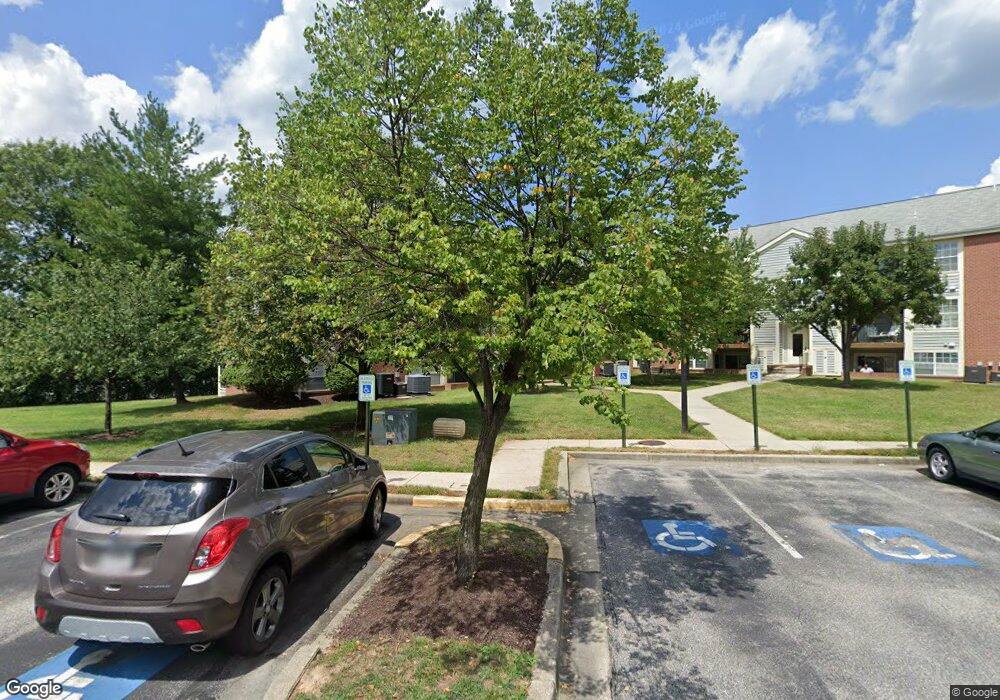
109 Water Fountain Way Unit 204 Glen Burnie, MD 21060
Estimated Value: $183,000 - $195,000
--
Bed
2
Baths
692
Sq Ft
$272/Sq Ft
Est. Value
About This Home
This home is located at 109 Water Fountain Way Unit 204, Glen Burnie, MD 21060 and is currently estimated at $188,428, approximately $272 per square foot. 109 Water Fountain Way Unit 204 is a home located in Anne Arundel County with nearby schools including North Glen Elementary School, Lindale Middle School, and North County High School.
Ownership History
Date
Name
Owned For
Owner Type
Purchase Details
Closed on
May 14, 2024
Sold by
Tlh Td Properties Llc
Bought by
Somers Eryn Lynn
Current Estimated Value
Home Financials for this Owner
Home Financials are based on the most recent Mortgage that was taken out on this home.
Original Mortgage
$166,250
Outstanding Balance
$163,980
Interest Rate
7.02%
Mortgage Type
New Conventional
Estimated Equity
$24,448
Purchase Details
Closed on
Oct 25, 2023
Sold by
County Of Anne Arundel
Bought by
East Coast Tax Auction Llc and Tlh Td Properties Llc
Purchase Details
Closed on
Jun 17, 2009
Sold by
Ryer Gary R
Bought by
Wright Cheryl
Purchase Details
Closed on
Feb 5, 1992
Sold by
Cromwell Fountain Assocs
Bought by
Ryer Gary R
Home Financials for this Owner
Home Financials are based on the most recent Mortgage that was taken out on this home.
Original Mortgage
$39,200
Interest Rate
8.68%
Create a Home Valuation Report for This Property
The Home Valuation Report is an in-depth analysis detailing your home's value as well as a comparison with similar homes in the area
Home Values in the Area
Average Home Value in this Area
Purchase History
| Date | Buyer | Sale Price | Title Company |
|---|---|---|---|
| Somers Eryn Lynn | $175,000 | Dulaney Title | |
| East Coast Tax Auction Llc | $108,016 | New World Title | |
| East Coast Tax Auction Llc | $108,016 | New World Title | |
| Wright Cheryl | -- | -- | |
| Ryer Gary R | $69,200 | -- |
Source: Public Records
Mortgage History
| Date | Status | Borrower | Loan Amount |
|---|---|---|---|
| Open | Somers Eryn Lynn | $166,250 | |
| Previous Owner | Ryer Gary R | $39,200 |
Source: Public Records
Tax History Compared to Growth
Tax History
| Year | Tax Paid | Tax Assessment Tax Assessment Total Assessment is a certain percentage of the fair market value that is determined by local assessors to be the total taxable value of land and additions on the property. | Land | Improvement |
|---|---|---|---|---|
| 2025 | $1,583 | $155,700 | $77,800 | $77,900 |
| 2024 | $1,583 | $144,167 | $0 | $0 |
| 2023 | $1,083 | $132,633 | $0 | $0 |
| 2022 | $1,266 | $121,100 | $60,500 | $60,600 |
| 2021 | $1,970 | $113,000 | $0 | $0 |
| 2020 | $960 | $104,900 | $0 | $0 |
| 2019 | $1,824 | $96,800 | $48,400 | $48,400 |
| 2018 | $935 | $92,200 | $0 | $0 |
| 2017 | $4 | $87,600 | $0 | $0 |
| 2016 | -- | $83,000 | $0 | $0 |
| 2015 | -- | $83,000 | $0 | $0 |
| 2014 | -- | $83,000 | $0 | $0 |
Source: Public Records
Map
Nearby Homes
- 105 Water Fountain Way Unit 203
- 6604 Rapid Water Way Unit 102
- 6603 Rapid Water Way Unit 203
- 6515 Polynesian Ln
- 6608 Rapid Water Way Unit 102
- 6506 Eiderdown Ct
- 6609 Fable Ct
- 315 Morris Hill Ave
- 308 Blue Water Ct Unit 102
- 6800 White Water Way Unit 203
- 6801 White Water Way Unit 301
- 6503 Home Water Way Unit 302
- 6528 Clear Drop Ct Unit 203
- 428 Azalea Place
- 202 Juneberry Way Unit 2C
- 302 Juneberry Way Unit 1D
- 6420 Jefferson Place
- 307 Shipley Ave
- 104 Wellham Ave NW
- 6433 Lamplighter Ridge
- 109 Water Fountain Way Unit 301
- 109 Water Fountain Way Unit 303
- 109 Water Fountain Way Unit 102
- 109 Water Fountain Way Unit 102
- 109 Water Fountain Way Unit 20
- 109 Water Fountain Way Unit 303
- 109 Water Fountain Way Unit 301
- 109 Water Fountain Way Unit 202
- 109 Water Fountain Way Unit 103
- 109 Water Fountain Way Unit 302
- 109 Water Fountain Way Unit 104
- 109 Water Fountain Way Unit 101
- 109 Water Fountain Way Unit 203
- 109 Water Fountain Way Unit 302
- 109 Water Fountain Way Unit 204
- 109 Water Fountain Way Unit 203
- 109 Water Fountain Way Unit 104
- 109 Water Fountain Way Unit 103
- 107 Water Fountain Way Unit 303
- 107 Water Fountain Way Unit 304