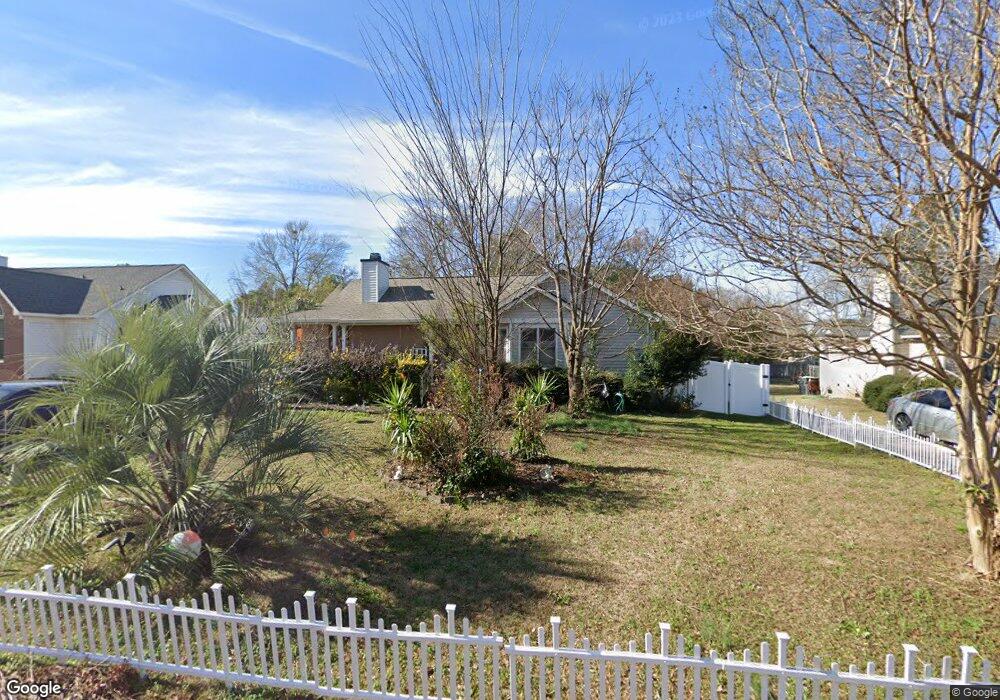
109 Whitewing Dr Lexington, SC 29073
Estimated Value: $215,000 - $220,000
3
Beds
2
Baths
1,248
Sq Ft
$174/Sq Ft
Est. Value
About This Home
This home is located at 109 Whitewing Dr, Lexington, SC 29073 and is currently estimated at $217,081, approximately $173 per square foot. 109 Whitewing Dr is a home located in Lexington County with nearby schools including Saxe Gotha Elementary School, White Knoll Middle School, and White Knoll High School.
Ownership History
Date
Name
Owned For
Owner Type
Purchase Details
Closed on
May 29, 2009
Sold by
Gunter James
Bought by
Childs Angela Faye
Current Estimated Value
Home Financials for this Owner
Home Financials are based on the most recent Mortgage that was taken out on this home.
Original Mortgage
$112,917
Outstanding Balance
$71,343
Interest Rate
4.77%
Mortgage Type
FHA
Estimated Equity
$145,739
Purchase Details
Closed on
May 30, 2008
Sold by
Burr Michael
Bought by
Gunter James
Home Financials for this Owner
Home Financials are based on the most recent Mortgage that was taken out on this home.
Original Mortgage
$91,278
Interest Rate
6.02%
Mortgage Type
FHA
Purchase Details
Closed on
Jun 9, 2006
Sold by
Amacher Diane M
Bought by
Burr Michael
Purchase Details
Closed on
Jun 24, 2002
Sold by
Zorn Harold Franklin
Bought by
Cacka Joe
Purchase Details
Closed on
Jun 21, 2002
Sold by
Blackwell Tim J
Bought by
Amacher Diane M
Create a Home Valuation Report for This Property
The Home Valuation Report is an in-depth analysis detailing your home's value as well as a comparison with similar homes in the area
Home Values in the Area
Average Home Value in this Area
Purchase History
| Date | Buyer | Sale Price | Title Company |
|---|---|---|---|
| Childs Angela Faye | $115,000 | -- | |
| Gunter James | $92,000 | -- | |
| Burr Michael | -- | None Available | |
| Cacka Joe | $111,000 | -- | |
| Amacher Diane M | $95,900 | -- |
Source: Public Records
Mortgage History
| Date | Status | Borrower | Loan Amount |
|---|---|---|---|
| Open | Childs Angela Faye | $112,917 | |
| Previous Owner | Gunter James | $91,278 |
Source: Public Records
Tax History
| Year | Tax Paid | Tax Assessment Tax Assessment Total Assessment is a certain percentage of the fair market value that is determined by local assessors to be the total taxable value of land and additions on the property. | Land | Improvement |
|---|---|---|---|---|
| 2024 | $740 | $4,537 | $1,000 | $3,537 |
| 2023 | $678 | $4,537 | $1,000 | $3,537 |
| 2022 | $676 | $4,537 | $1,000 | $3,537 |
| 2020 | $693 | $4,537 | $1,000 | $3,537 |
| 2019 | $644 | $4,136 | $1,000 | $3,136 |
| 2018 | $632 | $4,136 | $1,000 | $3,136 |
| 2017 | $613 | $4,136 | $1,000 | $3,136 |
| 2016 | $607 | $4,135 | $1,000 | $3,135 |
| 2014 | $645 | $4,599 | $1,000 | $3,599 |
| 2013 | -- | $4,600 | $1,000 | $3,600 |
Source: Public Records
Map
Nearby Homes
- 145 Condor Route
- 58 Mayapple Dr
- 912 Dovefield Ln
- 915 Dovefield Ln
- 2409 Bold Ruler Rd
- 2326 Damascus Way
- 2416 Bold Ruler Rd
- 2330 Damascus Way
- 2325 Damascus Way
- 2314 Damascus Way
- 2334 Damascus Way
- 2424 Bold Ruler Rd
- 442 Finch Ln
- 2318 Damascus Way
- 434 Finch Ln
- 2412 Bold Ruler Rd
- 2329 Damascus Way
- 2518 Winning Colors Way
- 2333 Damascus Rd
- 2522 Winning Colors Way
- 105 Whitewing Dr
- 113 Whitewing Dr
- 108 Macaw Ln
- 117 Whitewing Dr
- 112 Macaw Ln
- 104 Macaw Ln
- 116 Toucan Way
- 114 Toucan Way
- 112 Whitewing Dr
- 108 Whitewing Dr
- 118 Toucan Way
- 116 Macaw Ln
- 116 Whitewing Dr
- 104 Whitewing Dr
- 121 Whitewing Dr
- 120 Toucan Way
- 120 Whitewing Dr
- 110 Toucan Way
- 120 Macaw Ln
- 124 Whitewing Dr