Estimated Value: $177,001 - $235,000
3
Beds
2
Baths
2,220
Sq Ft
$92/Sq Ft
Est. Value
About This Home
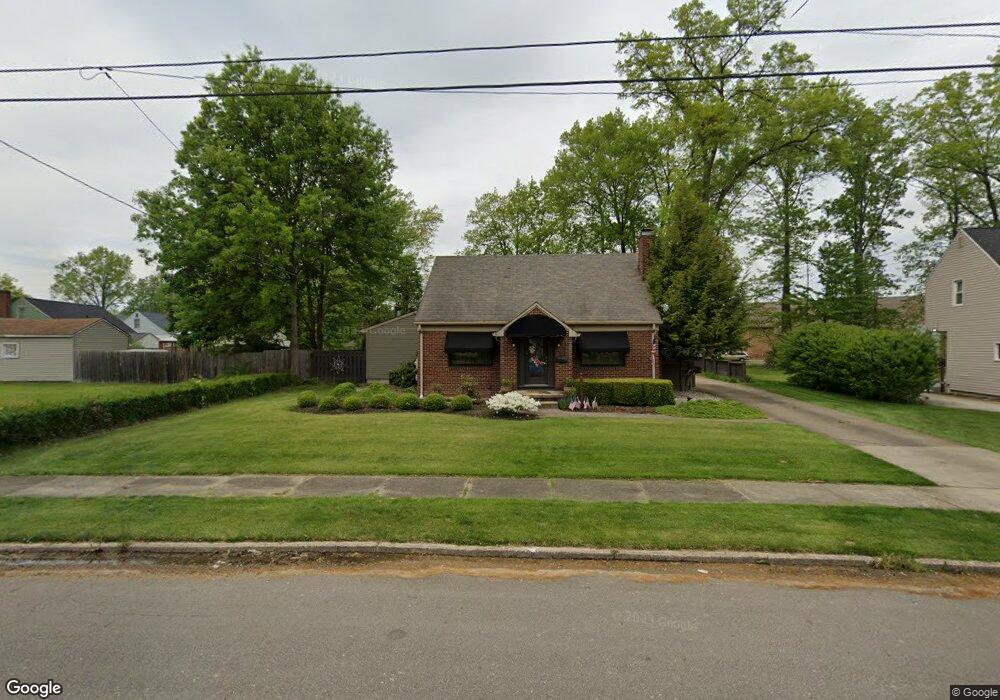
This home is located at 109 Wilson Ave, Niles, OH 44446 and is currently estimated at $203,750, approximately $91 per square foot. 109 Wilson Ave is a home located in Trumbull County with nearby schools including Niles Primary School, Niles Intermediate School, and Niles Middle School.
Ownership History
Date
Name
Owned For
Owner Type
Purchase Details
Closed on
Oct 28, 2015
Sold by
Labuda Raymond A Labuda Donna M
Bought by
Labuda Susan Labuda Sch
Current Estimated Value
Home Financials for this Owner
Home Financials are based on the most recent Mortgage that was taken out on this home.
Interest Rate
3.79%
Purchase Details
Closed on
Oct 9, 2015
Sold by
Co-Trustees Susan Labuda Schrop Raymond Labuda
Bought by
Labuda Raymond A Labuda D
Home Financials for this Owner
Home Financials are based on the most recent Mortgage that was taken out on this home.
Interest Rate
3.79%
Purchase Details
Closed on
Dec 7, 2010
Sold by
Labuda Raymond A and Labuda Donna M
Bought by
Schrop Susan Labuda and Labuda Raymond
Purchase Details
Closed on
Dec 31, 2001
Sold by
Schrop Susan Labuda
Bought by
Labuda Raymond A and Labuda Donna L
Purchase Details
Closed on
Jan 1, 1990
Bought by
Erwin Erwin T and Erwin Emma
Create a Home Valuation Report for This Property
The Home Valuation Report is an in-depth analysis detailing your home's value as well as a comparison with similar homes in the area
Home Values in the Area
Average Home Value in this Area
Purchase History
| Date | Buyer | Sale Price | Title Company |
|---|---|---|---|
| Labuda Susan Labuda Sch | -- | -- | |
| Labuda Raymond A Labuda D | -- | -- | |
| Schrop Susan Labuda | -- | Attorney | |
| Labuda Raymond A | -- | -- | |
| Erwin Erwin T | -- | -- |
Source: Public Records
Mortgage History
| Date | Status | Borrower | Loan Amount |
|---|---|---|---|
| Closed | Labuda Raymond A | -- | |
| Closed | Labuda Raymond A | -- |
Source: Public Records
Tax History Compared to Growth
Tax History
| Year | Tax Paid | Tax Assessment Tax Assessment Total Assessment is a certain percentage of the fair market value that is determined by local assessors to be the total taxable value of land and additions on the property. | Land | Improvement |
|---|---|---|---|---|
| 2024 | $1,627 | $48,800 | $6,060 | $42,740 |
| 2023 | $1,627 | $48,800 | $6,060 | $42,740 |
| 2022 | $1,546 | $40,400 | $6,060 | $34,340 |
| 2021 | $1,623 | $40,400 | $6,060 | $34,340 |
| 2020 | $1,638 | $40,400 | $6,060 | $34,340 |
| 2019 | $1,464 | $35,670 | $6,060 | $29,610 |
| 2018 | $1,459 | $35,670 | $6,060 | $29,610 |
| 2017 | $1,451 | $35,670 | $6,060 | $29,610 |
| 2016 | $1,513 | $36,550 | $6,060 | $30,490 |
| 2015 | $1,496 | $36,550 | $6,060 | $30,490 |
| 2014 | $1,501 | $36,550 | $6,060 | $30,490 |
| 2013 | $1,638 | $40,710 | $6,060 | $34,650 |
Source: Public Records
Map
Nearby Homes
- 57 Wilson Ave
- 145 North Rd
- 245 North Rd
- 34 Franklin Ave
- 38 Franklin Ave
- 512 John St
- 0 Federal
- 409 West St
- 613 North Rd
- 0 Harrison St
- 215 Holford Ave
- 220 Neil St
- 158 N Arlington Ave
- 125 N Arlington Ave
- 164 Summerberry Ln
- 47 Woodland Chase Blvd Unit 47
- 32 Linden Ave
- 719 Lafayette Ave
- 304 Cherry Ave
- 695 Trumbull Dr